Supercuts 2010 Annual Report Download - page 42
Download and view the complete annual report
Please find page 42 of the 2010 Supercuts annual report below. You can navigate through the pages in the report by either clicking on the pages listed below, or by using the keyword search tool below to find specific information within the annual report.-
 1
1 -
2
-
3
-
4
-
5
-
6
-
7
-
8
-
9
-
10
-
11
-
12
-
13
-
14
-
15
-
16
-
17
-
18
-
19
-
20
-
21
-
22
-
23
-
24
-
25
-
26
-
27
-
28
-
29
-
30
-
31
-
 32
32 -
 33
33 -
 34
34 -
 35
35 -
 36
36 -
 37
37 -
 38
38 -
 39
39 -
 40
40 -
 41
41 -
 42
42 -
 43
43 -
 44
44 -
 45
45 -
 46
46 -
 47
47 -
 48
48 -
 49
49 -
 50
50 -
 51
51 -
 52
52 -
53
-
54
-
55
-
56
-
57
-
58
-
59
-
60
-
61
-
62
-
63
-
64
-
65
-
66
-
67
-
68
-
69
-
70
-
71
-
72
-
73
-
74
-
75
-
76
-
77
-
78
-
79
-
80
-
81
-
82
-
83
-
84
-
85
-
86
-
87
-
88
-
89
-
90
-
91
-
92
-
93
-
94
-
95
-
96
-
97
-
98
-
99
-
100
-
101
-
102
-
103
-
104
-
105
-
106
-
107
-
108
-
109
-
110
-
111
-
112
-
113
-
114
-
115
-
116
-
117
-
118
-
119
-
120
-
121
-
122
-
123
-
124
-
125
-
126
-
127
-
128
-
129
-
130
-
131
-
132
-
133
-
134
-
135
-
136
-
137
-
138
-
139
-
140
-
141
-
142
-
143
-
144
-
145
-
146
-
147
-
148
-
149
-
150
-
151
-
152
-
153
-
154
-
155
-
156
-
157
-
158
-
159
-
160
-
161
-
162
-
163
-
164
-
165
-
166
-
167
-
168
-
169
-
170
-
171
-
172
-
173
-
174
-
175
-
176
-
177
-
178
-
179
-
180
-
181
-
182
-
183
-
184
-
185
-
186
-
187
-
188
-
189
-
190
-
191
-
192
-
193
-
194
-
195
-
196
-
197
-
198
-
199
-
200
-
201
-
202
-
203
-
204
-
205
-
206
-
207
-
208
-
209
-
210
-
211
-
212
-
213
-
214
-
215
-
216
-
217
-
218
-
219
-
220
-
221
 |
 |

Table of Contents
• Site operating expenses were positively impacted by a $1.7 million pre-tax change in estimate of the Company's self-insurance
accruals, primarily general liability.
• Lease termination costs of $2.1 million were incurred as a result of the Company's planned closure of up to 80 underperforming
company-owned salons in the United Kingdom.
• The Company recorded a $5.2 million charge related to the settlement of two legal claims regarding certain customer and
employee matters.
• The Company recorded $18.0 million in charges related to make-whole payments and other fees associated with the repayment
of private placement debt.
• In August 2010 the Company retained Peter J. Solomon Company, L.P. as its financial advisor and Faegre & Benson LLP and
Wachtell, Lipton, Rosen & Katz as its legal advisors to explore strategic alternatives to enhance shareholder value. There can be
no assurance that the review of strategic alternatives will result in any agreement or transaction.
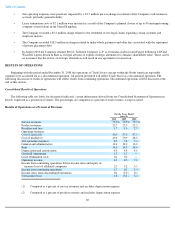
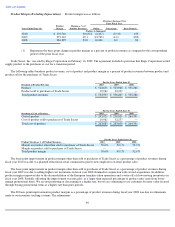
RESULTS OF OPERATIONS
Beginning with the period ended December 31, 2008 the operations of Trade Secret concept within the North American reportable
segment were accounted for as a discontinued operation. All periods presented will reflect Trade Secret as a discontinued operation. The
following discussion of results of operations will reflect results from continuing operations. Discontinued operations will be discussed at the
end of this section.
Consolidated Results of Operations
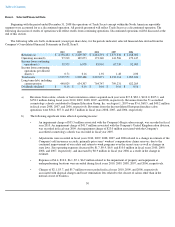
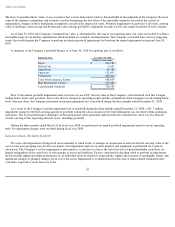
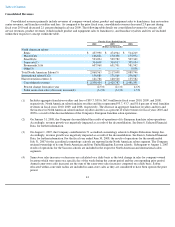
The following table sets forth, for the periods indicated, certain information derived from our Consolidated Statement of Operations in
Item 8, expressed as a percent of revenues. The percentages are computed as a percent of total revenues, except as noted.
Results of Operations as a Percent of Revenues
40
For the Years Ended
June 30,
2010 2009 2008
Service revenues
75.6
%
75.5
%
75.1
%
Product revenues
22.7
22.9
22.2
Royalties and fees
1.7
1.6
2.7
Operating expenses:
Cost of service(1)
56.9
57.0
57.1
Cost of product(2)
49.4
50.9
48.0
Site operating expenses
8.5
7.8
7.4
General and administrative
12.4
12.0
13.0
Rent
14.6
14.3
14.6
Depreciation and amortization
4.6
4.8
4.6
Goodwill impairment
1.5
1.7
—
Lease termination costs
0.1
0.2
—
Operating income
4.1
4.5
7.0
Income from continuing operations before income taxes and equity in
income (loss) of affiliated companies
2.3
3.2
5.5
Income from continuing operations
1.7
0.3
3.4
Income (loss) from discontinued operations
0.1
(5.4
)
0.1
Net income (loss)
1.8
(5.1
)
3.4
(1) Computed as a percent of service revenues and excludes depreciation expense.
(2)
Computed as a percent of product revenues and excludes depreciation expense.