Supercuts 2010 Annual Report Download - page 33
Download and view the complete annual report
Please find page 33 of the 2010 Supercuts annual report below. You can navigate through the pages in the report by either clicking on the pages listed below, or by using the keyword search tool below to find specific information within the annual report.-
 1
1 -
2
-
3
-
4
-
5
-
6
-
7
-
8
-
9
-
10
-
11
-
12
-
13
-
14
-
15
-
16
-
17
-
18
-
19
-
20
-
21
-
22
-
 23
23 -
 24
24 -
 25
25 -
 26
26 -
 27
27 -
 28
28 -
 29
29 -
 30
30 -
 31
31 -
 32
32 -
 33
33 -
 34
34 -
 35
35 -
 36
36 -
 37
37 -
 38
38 -
 39
39 -
 40
40 -
 41
41 -
 42
42 -
 43
43 -
44
-
45
-
46
-
47
-
48
-
49
-
50
-
51
-
52
-
53
-
54
-
55
-
56
-
57
-
58
-
59
-
60
-
61
-
62
-
63
-
64
-
65
-
66
-
67
-
68
-
69
-
70
-
71
-
72
-
73
-
74
-
75
-
76
-
77
-
78
-
79
-
80
-
81
-
82
-
83
-
84
-
85
-
86
-
87
-
88
-
89
-
90
-
91
-
92
-
93
-
94
-
95
-
96
-
97
-
98
-
99
-
100
-
101
-
102
-
103
-
104
-
105
-
106
-
107
-
108
-
109
-
110
-
111
-
112
-
113
-
114
-
115
-
116
-
117
-
118
-
119
-
120
-
121
-
122
-
123
-
124
-
125
-
126
-
127
-
128
-
129
-
130
-
131
-
132
-
133
-
134
-
135
-
136
-
137
-
138
-
139
-
140
-
141
-
142
-
143
-
144
-
145
-
146
-
147
-
148
-
149
-
150
-
151
-
152
-
153
-
154
-
155
-
156
-
157
-
158
-
159
-
160
-
161
-
162
-
163
-
164
-
165
-
166
-
167
-
168
-
169
-
170
-
171
-
172
-
173
-
174
-
175
-
176
-
177
-
178
-
179
-
180
-
181
-
182
-
183
-
184
-
185
-
186
-
187
-
188
-
189
-
190
-
191
-
192
-
193
-
194
-
195
-
196
-
197
-
198
-
199
-
200
-
201
-
202
-
203
-
204
-
205
-
206
-
207
-
208
-
209
-
210
-
211
-
212
-
213
-
214
-
215
-
216
-
217
-
218
-
219
-
220
-
221
 |
 |

Table of Contents
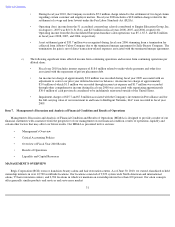
Item 7. Management's Discussion and Analysis of Financial Condition and Results of Operations
Management's Discussion and Analysis of Financial Condition and Results of Operations (MD&A) is designed to provide a reader of our
financial statements with a narrative from the perspective of our management on our financial condition, results of operations, liquidity and
certain other factors that may affect our future results. Our MD&A is presented in five sections:
• Management's Overview
• Critical Accounting Policies
• Overview of Fiscal Year 2010 Results
• Results of Operations
• Liquidity and Capital Resources
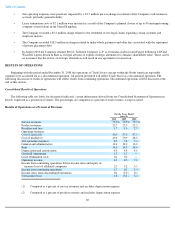
MANAGEMENT'S OVERVIEW
Regis Corporation (RGS) owns or franchises beauty salons and hair restoration centers. As of June 30, 2010, we owned, franchised or held
ownership interests in over 12,700 worldwide locations. Our locations consisted of 9,929 system wide North American and international
salons, 95 hair restoration centers, and 2,704 locations in which we maintain an ownership interest less than 100 percent. Our salon concepts
offer generally similar products and services and serve mass market
31
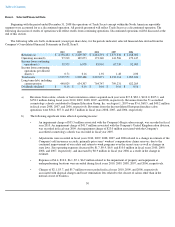
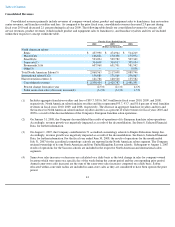
• During fiscal year 2010, the Company recorded a $5.2 million charge related to the settlement of two legal claims
regarding certain customer and employee matters. Fiscal year 2006 includes a $2.8 million charge related to the
settlement of a wage and hour lawsuit under the Fair Labor Standards Act (FLSA).
•
Operating (loss) income from the 51 accredited cosmetology schools contributed to Empire Education Group, Inc.
on August 1, 2007 was $(0.3), $(18.6), and $2.3 million in fiscal years 2008, 2007, and 2006, respectively.
Operating income from the deconsolidated European franchise salon operations was $5.1, $7.5, and $4.8 million
in fiscal years 2008, 2007, and 2006, respectively.
• A net settlement gain of $33.7 million was recognized during fiscal year 2006 stemming from a termination fee
collected from Alberto-Culver Company due to the terminated merger agreement for Sally Beauty Company. The
termination fee gain is net of direct transaction-
related expenses associated with the terminated merger agreement.
c) The following significant items affected income from continuing operations and income from continuing operations per
diluted share:
• Fiscal year 2010 includes interest expense of $18.0 million related to make-whole payments and other fees
associated with the repayment of private placement debt.
• An income tax charge of approximately $3.8 million was recorded during fiscal year 2009 associated with an
adjustment to correct our prior year deferred income tax balances. An income tax charge of approximately
$3.0 million of which $1.3 million was recorded through income tax expense and $1.7 million was recorded
through other comprehensive income during fiscal year 2008 was associated with repatriating approximately
$30.0 million of cash previously considered to be indefinitely reinvested outside of the United States.
• Impairment charges of $25.7 and $7.8 million associated with the Company's investment in Provalliance and for
the full carrying value of our investment in and loans to Intelligent Nutrients, LLC were recorded in fiscal year
2009.