Supercuts 2010 Annual Report Download - page 49
Download and view the complete annual report
Please find page 49 of the 2010 Supercuts annual report below. You can navigate through the pages in the report by either clicking on the pages listed below, or by using the keyword search tool below to find specific information within the annual report.-
 1
1 -
2
-
3
-
4
-
5
-
6
-
7
-
8
-
9
-
10
-
11
-
12
-
13
-
14
-
15
-
16
-
17
-
18
-
19
-
20
-
21
-
22
-
23
-
24
-
25
-
26
-
27
-
28
-
29
-
30
-
31
-
32
-
33
-
34
-
35
-
36
-
37
-
38
-
 39
39 -
 40
40 -
 41
41 -
 42
42 -
 43
43 -
 44
44 -
 45
45 -
 46
46 -
 47
47 -
 48
48 -
 49
49 -
 50
50 -
 51
51 -
 52
52 -
 53
53 -
 54
54 -
 55
55 -
 56
56 -
 57
57 -
 58
58 -
 59
59 -
60
-
61
-
62
-
63
-
64
-
65
-
66
-
67
-
68
-
69
-
70
-
71
-
72
-
73
-
74
-
75
-
76
-
77
-
78
-
79
-
80
-
81
-
82
-
83
-
84
-
85
-
86
-
87
-
88
-
89
-
90
-
91
-
92
-
93
-
94
-
95
-
96
-
97
-
98
-
99
-
100
-
101
-
102
-
103
-
104
-
105
-
106
-
107
-
108
-
109
-
110
-
111
-
112
-
113
-
114
-
115
-
116
-
117
-
118
-
119
-
120
-
121
-
122
-
123
-
124
-
125
-
126
-
127
-
128
-
129
-
130
-
131
-
132
-
133
-
134
-
135
-
136
-
137
-
138
-
139
-
140
-
141
-
142
-
143
-
144
-
145
-
146
-
147
-
148
-
149
-
150
-
151
-
152
-
153
-
154
-
155
-
156
-
157
-
158
-
159
-
160
-
161
-
162
-
163
-
164
-
165
-
166
-
167
-
168
-
169
-
170
-
171
-
172
-
173
-
174
-
175
-
176
-
177
-
178
-
179
-
180
-
181
-
182
-
183
-
184
-
185
-
186
-
187
-
188
-
189
-
190
-
191
-
192
-
193
-
194
-
195
-
196
-
197
-
198
-
199
-
200
-
201
-
202
-
203
-
204
-
205
-
206
-
207
-
208
-
209
-
210
-
211
-
212
-
213
-
214
-
215
-
216
-
217
-
218
-
219
-
220
-
221
 |
 |

Table of Contents
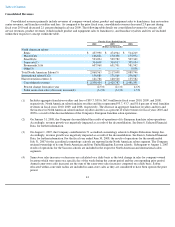
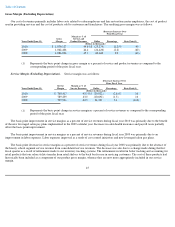
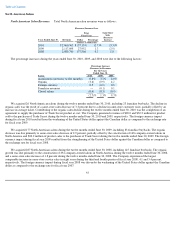
resulted in better tracking and accounting for retail products that our salon stylists transfer from retail shelves to the back bar for use in
servicing customers. The cost of these products had historically been included as a component of our product gross margin, whereas they are
now more appropriately included in our service margin. In addition, product margins improved due to the deconsolidation of the beauty schools
and European franchise salon operations.
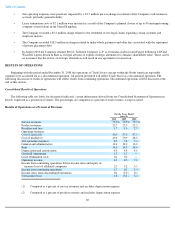
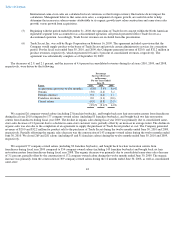
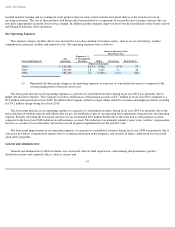
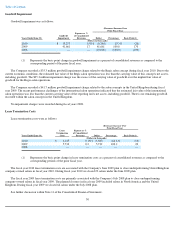
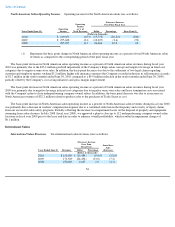
Site Operating Expenses
This expense category includes direct costs incurred by our salons and hair restoration centers, such as on-site advertising, workers'
compensation, insurance, utilities and janitorial costs. Site operating expenses were as follows:
The basis point increase in site operating expenses as a percent of consolidated revenues during fiscal year 2010 was primarily due to
higher self insurance expense. The Company recorded a reduction in self insurance accruals of $1.7 million in fiscal year 2010 compared to a
$9.9 million reduction in fiscal year 2009. In addition the Company settled two legal claims related to customer and employee matters resulting
in a $5.2 million charge during fiscal year 2010.
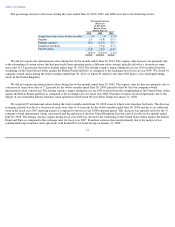
The basis point increase in site operating expenses as a percent of consolidated revenues during fiscal year 2009 was primarily due to the
reclassification of rubbish removal and utilities that we pay our landlords as part of our operating lease agreements from rent into site operating
expense. Partially offsetting the basis point increase was an incremental $3.0 million benefit due to the reduction in self insurance accruals
compared to the fiscal year 2008 reduction in self insurance accruals. The reduction was primarily related to prior years' workers' compensation
reserves as a result of successful safety and return-to-work programs implemented over the past few years.
The basis point improvement in site operating expenses as a percent of consolidated revenues during fiscal year 2008 was primarily due to
a decrease in workers' compensation expense due to a continued reduction in the frequency and severity of injury claims from our successful
salon safety programs.
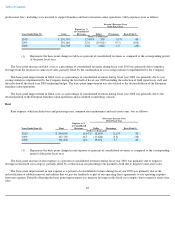
General and Administrative
General and administrative (G&A) includes costs associated with our field supervision, salon training and promotions, product
distribution centers and corporate offices (such as salaries and
47
Increase (Decrease) Over
Prior Fiscal Year
Years Ended June 30, Site
Operating
Expense as %
of Consolidated
Revenues Dollar Percentage Basis Point(1)
(Dollars in thousands)
2010
$
199,338
8.5
%
$
8,882
4.7
%
70
2009
190,456
7.8
5,687
3.1
40
2008
184,769
7.4
(5,845
)
(3.1
)
(60
)
(1) Represents the basis point change in site operating expenses as a percent of consolidated revenues as compared to the
corresponding period of the prior fiscal year.