Supercuts 2010 Annual Report Download - page 54
Download and view the complete annual report
Please find page 54 of the 2010 Supercuts annual report below. You can navigate through the pages in the report by either clicking on the pages listed below, or by using the keyword search tool below to find specific information within the annual report.-
 1
1 -
2
-
3
-
4
-
5
-
6
-
7
-
8
-
9
-
10
-
11
-
12
-
13
-
14
-
15
-
16
-
17
-
18
-
19
-
20
-
21
-
22
-
23
-
24
-
25
-
26
-
27
-
28
-
29
-
30
-
31
-
32
-
33
-
34
-
35
-
36
-
37
-
38
-
39
-
40
-
41
-
42
-
43
-
 44
44 -
 45
45 -
 46
46 -
 47
47 -
 48
48 -
 49
49 -
 50
50 -
 51
51 -
 52
52 -
 53
53 -
 54
54 -
 55
55 -
 56
56 -
 57
57 -
 58
58 -
 59
59 -
 60
60 -
 61
61 -
 62
62 -
 63
63 -
 64
64 -
65
-
66
-
67
-
68
-
69
-
70
-
71
-
72
-
73
-
74
-
75
-
76
-
77
-
78
-
79
-
80
-
81
-
82
-
83
-
84
-
85
-
86
-
87
-
88
-
89
-
90
-
91
-
92
-
93
-
94
-
95
-
96
-
97
-
98
-
99
-
100
-
101
-
102
-
103
-
104
-
105
-
106
-
107
-
108
-
109
-
110
-
111
-
112
-
113
-
114
-
115
-
116
-
117
-
118
-
119
-
120
-
121
-
122
-
123
-
124
-
125
-
126
-
127
-
128
-
129
-
130
-
131
-
132
-
133
-
134
-
135
-
136
-
137
-
138
-
139
-
140
-
141
-
142
-
143
-
144
-
145
-
146
-
147
-
148
-
149
-
150
-
151
-
152
-
153
-
154
-
155
-
156
-
157
-
158
-
159
-
160
-
161
-
162
-
163
-
164
-
165
-
166
-
167
-
168
-
169
-
170
-
171
-
172
-
173
-
174
-
175
-
176
-
177
-
178
-
179
-
180
-
181
-
182
-
183
-
184
-
185
-
186
-
187
-
188
-
189
-
190
-
191
-
192
-
193
-
194
-
195
-
196
-
197
-
198
-
199
-
200
-
201
-
202
-
203
-
204
-
205
-
206
-
207
-
208
-
209
-
210
-
211
-
212
-
213
-
214
-
215
-
216
-
217
-
218
-
219
-
220
-
221
 |
 |

Table of Contents
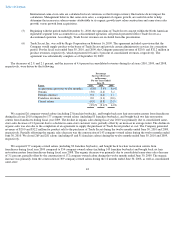
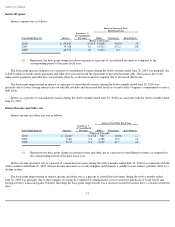
The basis point improvement in interest income and other, net as a percent of consolidated revenues during the twelve months ended
June 30, 2008 was primarily due to the increased interest income as a result of higher cash balances available to earn interest.
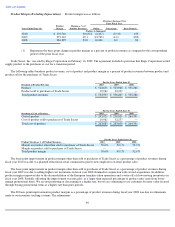
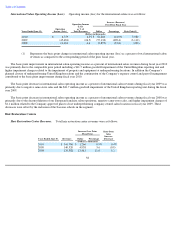
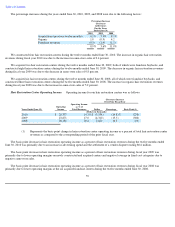
Income Taxes
Our reported effective tax rate was as follows:
The basis point improvement in our overall effective income tax rate for the fiscal year ended June 30, 2010 was primarily due to a
decrease in the impact of the non-cash goodwill impairment charge recorded during the year ended June 30, 2010 compared to the impact of
the non-cash goodwill impairment charge recorded during the year ended June 30, 2009 and an increase in the employment credits received. In
addition, a 0.9 percent decrease in the tax rate was due to adjustments to the income tax balances, which had a smaller impact than the charge
recorded in the prior year related to the adjustment of prior year deferred income taxes.
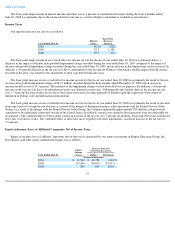
The basis point increase in our overall effective income tax rate for the fiscal year ended June 30, 2009 was primarily the result of the pre-
tax non-cash goodwill impairment charge of $41.7 million recorded during the three months ended December 31, 2008 which caused an
increase in the tax rate of 14.5 percent. The majority of the impairment charge was not deductible for tax purposes. In addition, a 4.8 percent
increase in the tax rate was due to an adjustment of prior year deferred income taxes. Offsetting the unfavorable shifts in the income tax rate
was a 7.3 percent decrease in the tax rate due to the release of reserves for unrecognized tax benefits upon the expiration of the statute of
limitation in federal, state and international jurisdictions.
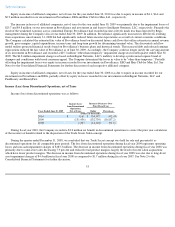
The basis point increase in our overall effective income tax rate for the fiscal year ended June 30, 2008 was primarily the result of the shift
in income from low to high tax jurisdictions as a result of the merger of European franchise salon operations with the Franck Provost Salon
Group. As a result of the merger with the Franck Provost Salon Group, the Company repatriated approximately $30 million cash previously
considered to be indefinitely reinvested outside of the United States. In addition, certain costs related to the transaction were not deductible for
tax purposes. The combined effect of these items caused an increase in the tax rate of 2.1 percent. In addition, Texas and other states introduced
new taxes or restrictive rules. The combined effect of these new taxes, together with other adjustments, caused an increase in the tax rate of
1.9 percent.
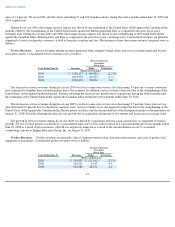
Equity in Income (Loss) of Affiliated Companies, Net of Income Taxes
Equity in income (loss) of affiliates, represents the income or loss generated by our equity investment in Empire Education Group, Inc.,
Provalliance, and other equity method investments was as follows:
52
Years Ended June 30, Effective
Rate
Basis Point
(Decrease)
Increase
2010
48.1
%
(520
)
2009
53.3
1,380
2008
39.5
410
Increase (Decrease)
Over Prior Fiscal Year
Equity
Income
(Loss)
Years Ended June 30, Dollar Percentage
(Dollars in thousands)
2010
$
11,942
$
41,788
140.0
%
2009
(29,846
)
(30,695
)
(3,615.4
)
2008
849
849
100.0