Supercuts 2010 Annual Report Download - page 44
Download and view the complete annual report
Please find page 44 of the 2010 Supercuts annual report below. You can navigate through the pages in the report by either clicking on the pages listed below, or by using the keyword search tool below to find specific information within the annual report.-
 1
1 -
2
-
3
-
4
-
5
-
6
-
7
-
8
-
9
-
10
-
11
-
12
-
13
-
14
-
15
-
16
-
17
-
18
-
19
-
20
-
21
-
22
-
23
-
24
-
25
-
26
-
27
-
28
-
29
-
30
-
31
-
32
-
33
-
 34
34 -
 35
35 -
 36
36 -
 37
37 -
 38
38 -
 39
39 -
 40
40 -
 41
41 -
 42
42 -
 43
43 -
 44
44 -
 45
45 -
 46
46 -
 47
47 -
 48
48 -
 49
49 -
 50
50 -
 51
51 -
 52
52 -
 53
53 -
 54
54 -
55
-
56
-
57
-
58
-
59
-
60
-
61
-
62
-
63
-
64
-
65
-
66
-
67
-
68
-
69
-
70
-
71
-
72
-
73
-
74
-
75
-
76
-
77
-
78
-
79
-
80
-
81
-
82
-
83
-
84
-
85
-
86
-
87
-
88
-
89
-
90
-
91
-
92
-
93
-
94
-
95
-
96
-
97
-
98
-
99
-
100
-
101
-
102
-
103
-
104
-
105
-
106
-
107
-
108
-
109
-
110
-
111
-
112
-
113
-
114
-
115
-
116
-
117
-
118
-
119
-
120
-
121
-
122
-
123
-
124
-
125
-
126
-
127
-
128
-
129
-
130
-
131
-
132
-
133
-
134
-
135
-
136
-
137
-
138
-
139
-
140
-
141
-
142
-
143
-
144
-
145
-
146
-
147
-
148
-
149
-
150
-
151
-
152
-
153
-
154
-
155
-
156
-
157
-
158
-
159
-
160
-
161
-
162
-
163
-
164
-
165
-
166
-
167
-
168
-
169
-
170
-
171
-
172
-
173
-
174
-
175
-
176
-
177
-
178
-
179
-
180
-
181
-
182
-
183
-
184
-
185
-
186
-
187
-
188
-
189
-
190
-
191
-
192
-
193
-
194
-
195
-
196
-
197
-
198
-
199
-
200
-
201
-
202
-
203
-
204
-
205
-
206
-
207
-
208
-
209
-
210
-
211
-
212
-
213
-
214
-
215
-
216
-
217
-
218
-
219
-
220
-
221
 |
 |

Table of Contents
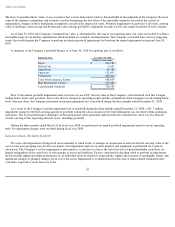
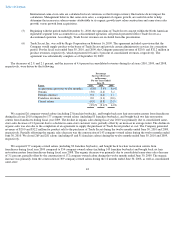
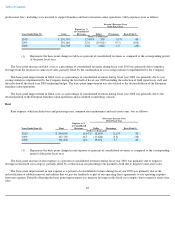
The decreases of 2.9, and 2.1 percent, and the increase of 4.6 percent in consolidated revenues during fiscal years 2010, 2009, and 2008,
respectively, were driven by the following:
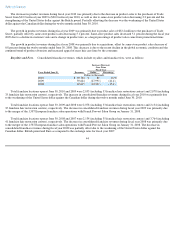
We acquired 26 company-owned salons (including 23 franchise buybacks), and bought back zero hair restoration centers from franchisees
during fiscal year 2010 compared to 177 company-owned salons (including 83 franchise buybacks), and bought back two hair restoration
centers from franchisees during fiscal year 2009. The decline in organic sales during fiscal year 2010 was primarily due to consolidated same-
store sales decrease of 3.2 percent due to a decline in same-
store customer visits, partially offset by an increase in average ticket. The decline in
organic sales was also due to the completion of an agreement to supply the purchaser of Trade Secret product at cost. The Company generated
revenues of $20.0 and $32.2 million for product sold to the purchaser of Trade Secret during the twelve months ended June 30, 2010 and 2009,
respectively. Partially offsetting the organic sales decrease was the construction of 143 company-
owned salons during the twelve months ended
June 30, 2010. We closed 269 and 281 salons (including 65 and 51 franchise salons) during the twelve months ended June 30, 2010 and 2009,
respectively.
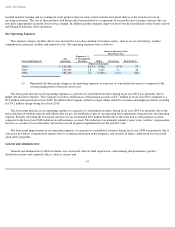
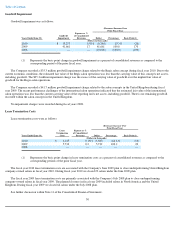
We acquired 177 company-owned salons (including 83 franchise buybacks), and bought back two hair restoration centers from
franchisees during fiscal year 2009 compared to 354 company-owned salons (including 145 franchise buybacks) and bought back six hair
restoration centers from franchisees during fiscal year 2008. The organic decrease was primarily due to consolidated same-store sales decrease
of 3.1 percent, partially offset by the construction of 172 company-owned salons during the twelve months ended June 30, 2009. The organic
increase was primarily from the construction of 309 company-owned salons during the 12 months ended June 30, 2008, as well as consolidated
same-store
42
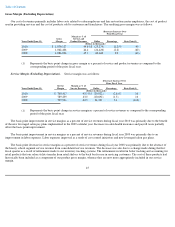
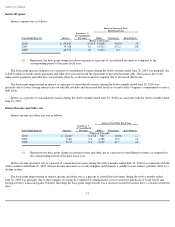
International same-store sales are calculated in local currencies so that foreign currency fluctuations do not impact the
calculation. Management believes that same-store sales, a component of organic growth, are useful in order to help
determine the increase in salon revenues attributable to its organic growth (new salon construction and same-store sales
growth) versus growth from acquisitions.
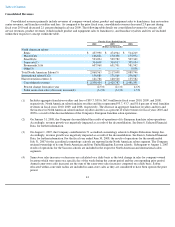
(5) Beginning with the period ended December 31, 2008, the operations of Trade Secret concept within the North American
reportable segment were accounted for as a discontinued operation. All periods presented reflect Trade Secret as a
discontinued operation. Accordingly, Trade Secret revenues are excluded from this presentation.
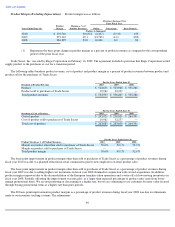
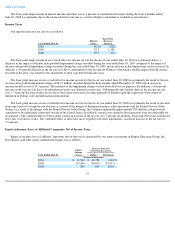
(6) Trade Secret, Inc. was sold by Regis Corporation on February 16, 2009. The agreement included a provision that the
Company would supply product to the buyer of Trade Secret and provide certain administrative services for a transition
period. For the fiscal year ended June 30, 2010, and 2009, the Company generated revenue of $20.0, and $32.2 million in
product revenues, respectively, which represented 0.8 and 1.3 percent of consolidated revenues, respectively. The
agreement was substantially complete as of September 30, 2009.
Percentage
Increase (Decrease)
in Revenues
For the Years Ended
June 30,
Factor 2010 2009 2008
Acquisitions (previous twelve months)
0.8
%
3.4
%
4.6
%
Organic
(3.0
)
(1.4
)
3.4
Foreign currency
0.2
(2.2
)
1.1
Franchise revenues
0.0
(1.1
)
(0.6
)
Closed salons
(0.9
)
(0.8
)
(3.9
)
(2.9
)%
(2.1
)%
4.6
%