Supercuts 2010 Annual Report Download - page 65
Download and view the complete annual report
Please find page 65 of the 2010 Supercuts annual report below. You can navigate through the pages in the report by either clicking on the pages listed below, or by using the keyword search tool below to find specific information within the annual report.-
 1
1 -
2
-
3
-
4
-
5
-
6
-
7
-
8
-
9
-
10
-
11
-
12
-
13
-
14
-
15
-
16
-
17
-
18
-
19
-
20
-
21
-
22
-
23
-
24
-
25
-
26
-
27
-
28
-
29
-
30
-
31
-
32
-
33
-
34
-
35
-
36
-
37
-
38
-
39
-
40
-
41
-
42
-
43
-
44
-
45
-
46
-
47
-
48
-
49
-
50
-
51
-
52
-
53
-
54
-
 55
55 -
 56
56 -
 57
57 -
 58
58 -
 59
59 -
 60
60 -
 61
61 -
 62
62 -
 63
63 -
 64
64 -
 65
65 -
 66
66 -
 67
67 -
 68
68 -
 69
69 -
 70
70 -
 71
71 -
 72
72 -
 73
73 -
 74
74 -
 75
75 -
76
-
77
-
78
-
79
-
80
-
81
-
82
-
83
-
84
-
85
-
86
-
87
-
88
-
89
-
90
-
91
-
92
-
93
-
94
-
95
-
96
-
97
-
98
-
99
-
100
-
101
-
102
-
103
-
104
-
105
-
106
-
107
-
108
-
109
-
110
-
111
-
112
-
113
-
114
-
115
-
116
-
117
-
118
-
119
-
120
-
121
-
122
-
123
-
124
-
125
-
126
-
127
-
128
-
129
-
130
-
131
-
132
-
133
-
134
-
135
-
136
-
137
-
138
-
139
-
140
-
141
-
142
-
143
-
144
-
145
-
146
-
147
-
148
-
149
-
150
-
151
-
152
-
153
-
154
-
155
-
156
-
157
-
158
-
159
-
160
-
161
-
162
-
163
-
164
-
165
-
166
-
167
-
168
-
169
-
170
-
171
-
172
-
173
-
174
-
175
-
176
-
177
-
178
-
179
-
180
-
181
-
182
-
183
-
184
-
185
-
186
-
187
-
188
-
189
-
190
-
191
-
192
-
193
-
194
-
195
-
196
-
197
-
198
-
199
-
200
-
201
-
202
-
203
-
204
-
205
-
206
-
207
-
208
-
209
-
210
-
211
-
212
-
213
-
214
-
215
-
216
-
217
-
218
-
219
-
220
-
221
 |
 |

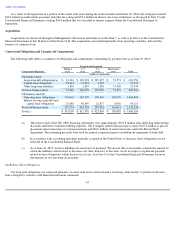
Table of Contents
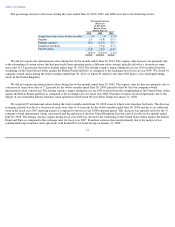
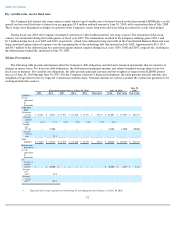
Investing Activities
Net cash used in investing activities during the twelve months ended June 30, 2010, 2009 and 2008 was the result of the following:
Cash used by investing activities was lower during fiscal year 2010 compared to fiscal year 2009 due to the planned reduction in
acquisitions and capital expenditures and the receipt of $15.0 million on the revolving credit facility with EEG of which there was $0.0 and
$15.0 million outstanding as of June 30, 2010 and 2009, respectively. The Company completed 333 major remodeling projects during fiscal
year 2010, compared to 280 and 186 during fiscal years 2009 and 2008, respectively. We constructed 139 company
-owned salons, 4 hair
restoration centers and acquired 26 company-owned salons (23 of which were franchise buybacks) and zero hair restoration centers.
Cash used by investing activities was lower during fiscal year 2009 compared to fiscal year 2008 due to the planned reduction in
acquisitions and capital expenditures. Acquisitions during fiscal year 2009 were primarily funded by a combination of operating cash flows and
debt. Additionally, the Company completed 280 major remodeling projects during fiscal year 2009, compared to 186 during fiscal year 2008.
We constructed 182 company-owned salons, eight hair restoration centers and acquired 177 company-owned salons (83 of which were
franchise buybacks) and two hair restoration centers, all of which were franchise buybacks. In addition during fiscal year 2008, there was a
$36.4 million loan to Empire Education Group, Inc. and a transfer of $10.9 million in cash related to the deconsolidation of our schools and
European franchise salon business.
Acquisitions during fiscal year 2008 were primarily funded by a combination of operating cash flows and debt. Additionally the Company
completed 186 major remodeling projects during fiscal year 2008, compared to 222 and 170 during fiscal years 2007 and 2006, respectively.
We constructed 325 company-owned salons, three hair restoration centers and acquired 382 company-owned salons (150 of which were
franchise buybacks) and six hair restoration centers, all of which were franchise buybacks. Investing activities also included a $36.4 million
loan to Empire Education Group, Inc. In addition, there was $10.9 million in cash held by the schools and European salon businesses that were
deconsolidated.
63
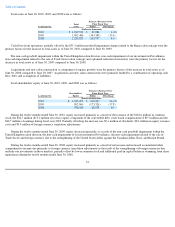
Investing Cash Flows
For the Years Ended June 30,
2010 2009 2008
(Dollars in thousands)
Business and salon acquisitions
$
(3,664
)
$
(40,051
)
$
(132,971
)
Capital expenditures for remodels or other additions
(40,561
)
(35,081
)
(35,212
)
Capital expenditures for the corporate office (including all
technology
-
related expenditures)
(7,828
)
(13,113
)
(18,310
)
Capital expenditures for new salon construction
(9,432
)
(25,380
)
(32,277
)
Proceeds from loans and investments
16,099
19,008
10,000
Disbursements for loans and investments
—
(
20,971
)
(46,400
)
Transfer of cash related to contribution of schools and
European franchise salon operations
—
—
(
10,906
)
Freestanding derivative settlement
736
—
—
Proceeds from sale of assets
70
77
47
$
(44,580
)
$
(115,511
)
$
(266,029
)