Supercuts 2010 Annual Report Download - page 159
Download and view the complete annual report
Please find page 159 of the 2010 Supercuts annual report below. You can navigate through the pages in the report by either clicking on the pages listed below, or by using the keyword search tool below to find specific information within the annual report.-
 1
1 -
2
-
3
-
4
-
5
-
6
-
7
-
8
-
9
-
10
-
11
-
12
-
13
-
14
-
15
-
16
-
17
-
18
-
19
-
20
-
21
-
22
-
23
-
24
-
25
-
26
-
27
-
28
-
29
-
30
-
31
-
32
-
33
-
34
-
35
-
36
-
37
-
38
-
39
-
40
-
41
-
42
-
43
-
44
-
45
-
46
-
47
-
48
-
49
-
50
-
51
-
52
-
53
-
54
-
55
-
56
-
57
-
58
-
59
-
60
-
61
-
62
-
63
-
64
-
65
-
66
-
67
-
68
-
69
-
70
-
71
-
72
-
73
-
74
-
75
-
76
-
77
-
78
-
79
-
80
-
81
-
82
-
83
-
84
-
85
-
86
-
87
-
88
-
89
-
90
-
91
-
92
-
93
-
94
-
95
-
96
-
97
-
98
-
99
-
100
-
101
-
102
-
103
-
104
-
105
-
106
-
107
-
108
-
109
-
110
-
111
-
112
-
113
-
114
-
115
-
116
-
117
-
118
-
119
-
120
-
121
-
122
-
123
-
124
-
125
-
126
-
127
-
128
-
129
-
130
-
131
-
132
-
133
-
134
-
135
-
136
-
137
-
138
-
139
-
140
-
141
-
142
-
143
-
144
-
145
-
146
-
147
-
148
-
 149
149 -
 150
150 -
 151
151 -
 152
152 -
 153
153 -
 154
154 -
 155
155 -
 156
156 -
 157
157 -
 158
158 -
 159
159 -
 160
160 -
 161
161 -
 162
162 -
 163
163 -
 164
164 -
 165
165 -
 166
166 -
 167
167 -
 168
168 -
 169
169 -
170
-
171
-
172
-
173
-
174
-
175
-
176
-
177
-
178
-
179
-
180
-
181
-
182
-
183
-
184
-
185
-
186
-
187
-
188
-
189
-
190
-
191
-
192
-
193
-
194
-
195
-
196
-
197
-
198
-
199
-
200
-
201
-
202
-
203
-
204
-
205
-
206
-
207
-
208
-
209
-
210
-
211
-
212
-
213
-
214
-
215
-
216
-
217
-
218
-
219
-
220
-
221
 |
 |

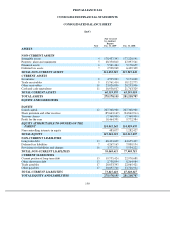
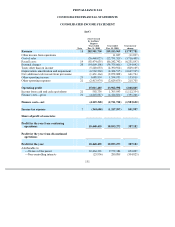
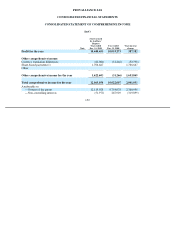
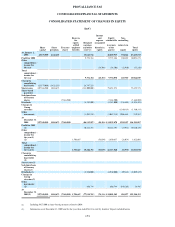
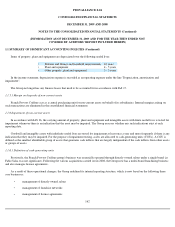
PROVALLIANCE SAS
CONSOLIDATED FINANCIAL STATEMENTS
CONSOLIDATED STATEMENT OF CHANGES IN EQUITY
(in €)
153
Share
capital
Share
premium
Treasury
shares
Reserves
for
equity-
settled
employee
benefits
Retained
earnings
and other
reserves
Income
and
expense
recognized
directly in
equity
Equity
attributable
to owners
of the
parent
Non-
controlling
interests in
equity
Total
equity
At January 1,
2008
25,375,000
1,422,225
15,663,712
42,460,937
704,626
43,165,563
Profit for 2008
9,772,384
9,772,384
280,889
10,053,273
Other
comprehensive
income for
the year
(18,306
)
(18,306
)
(12,960
)
(31,266
)
Total
comprehensive
income for
the year
9,772,384
(18,306
)
9,754,078
267,929
10,022,007
Change in
consolidating
legal entity
(25,375,000
)
(1,422,225
)
26,797,225
Share issues
207,368,900
1,083,673
(133,000,000
)
75,452,573
75,452,573
Share-based
payments
Sales/purchases
of treasury
shares
(7,368,900
)
(7,368,900
)
(7,368,900
)
Dividends
(4,282,000
)
(4,282,000
)
(316,494
)
(4,598,494
)
Changes in
Group
structure
(1,380,119
)
(1,380,119
)
Other
movements
(1,087,218
)
(1,087,218
)
2,006,485
919,267
At
December 31,
2008
207,368,900
1,083,673
(7,368,900
)
(86,135,897
)
(18,306
)
114,929,470
1,282,427
116,211,897
Profit for 2009
(2)
10,464,391
10,464,391
(23,936
)
10,440,455
Other
comprehensive
income for
the year(1)
(2)
1,706,667
(56,030
)
1,650,637
(28,034
)
1,622,603
Total
comprehensive
income for
the year(2)
1,706,667
10,464,391
(56,030
)
12,115,028
(51,970
)
12,063,058
Change in
consolidating
legal entity
(2)
Share issues(2)
Sales/purchases
of treasury
shares(2)
Dividends(2)
(2,930,000
)
(2,930,000
)
(99,119
)
(3,029,119
)
Changes in
Group
structure(2)
Other
movements
(2)
686,744
686,744
(648,261
)
38,483
At
December 31,
2009(2)
207,368,900
1,083,673
(7,368,900
)
1,706,667
(77,914,762
)
(74,336
)
124,801,242
483,077
125,284,319
(1)
Including €827,000 in share-based payments related to 2008
(2)
Information as of December 31, 2009 and for the year then ended Not Covered by Auditors' Report included herein