Supercuts 2010 Annual Report Download - page 74
Download and view the complete annual report
Please find page 74 of the 2010 Supercuts annual report below. You can navigate through the pages in the report by either clicking on the pages listed below, or by using the keyword search tool below to find specific information within the annual report.-
 1
1 -
2
-
3
-
4
-
5
-
6
-
7
-
8
-
9
-
10
-
11
-
12
-
13
-
14
-
15
-
16
-
17
-
18
-
19
-
20
-
21
-
22
-
23
-
24
-
25
-
26
-
27
-
28
-
29
-
30
-
31
-
32
-
33
-
34
-
35
-
36
-
37
-
38
-
39
-
40
-
41
-
42
-
43
-
44
-
45
-
46
-
47
-
48
-
49
-
50
-
51
-
52
-
53
-
54
-
55
-
56
-
57
-
58
-
59
-
60
-
61
-
62
-
63
-
 64
64 -
 65
65 -
 66
66 -
 67
67 -
 68
68 -
 69
69 -
 70
70 -
 71
71 -
 72
72 -
 73
73 -
 74
74 -
 75
75 -
 76
76 -
 77
77 -
 78
78 -
 79
79 -
 80
80 -
 81
81 -
 82
82 -
 83
83 -
 84
84 -
85
-
86
-
87
-
88
-
89
-
90
-
91
-
92
-
93
-
94
-
95
-
96
-
97
-
98
-
99
-
100
-
101
-
102
-
103
-
104
-
105
-
106
-
107
-
108
-
109
-
110
-
111
-
112
-
113
-
114
-
115
-
116
-
117
-
118
-
119
-
120
-
121
-
122
-
123
-
124
-
125
-
126
-
127
-
128
-
129
-
130
-
131
-
132
-
133
-
134
-
135
-
136
-
137
-
138
-
139
-
140
-
141
-
142
-
143
-
144
-
145
-
146
-
147
-
148
-
149
-
150
-
151
-
152
-
153
-
154
-
155
-
156
-
157
-
158
-
159
-
160
-
161
-
162
-
163
-
164
-
165
-
166
-
167
-
168
-
169
-
170
-
171
-
172
-
173
-
174
-
175
-
176
-
177
-
178
-
179
-
180
-
181
-
182
-
183
-
184
-
185
-
186
-
187
-
188
-
189
-
190
-
191
-
192
-
193
-
194
-
195
-
196
-
197
-
198
-
199
-
200
-
201
-
202
-
203
-
204
-
205
-
206
-
207
-
208
-
209
-
210
-
211
-
212
-
213
-
214
-
215
-
216
-
217
-
218
-
219
-
220
-
221
 |
 |

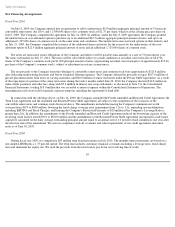
Table of Contents
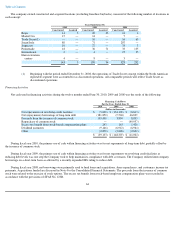
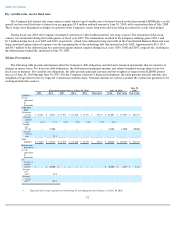
Pay variable rates, receive fixed rates
The Company had interest rate swap contracts under which it paid variable rates of interest (based on the three-
month LIBOR plus a credit
spread) and received fixed rates of interest on an aggregate $5.0 million notional amount at June 30, 2008, with a maturation date of July 2008.
These swaps were designated as hedges of a portion of the Company's senior term notes and were being accounted for as fair value hedges.
During fiscal year 2003, the Company terminated a portion of a $40.0 million interest rate swap contract. The remainder of this swap
contract was terminated during the fourth quarter of fiscal year 2005. The terminations resulted in the Company realizing gains of $1.1 and
$1.5 million during fiscal year 2005 and 2003, respectively, which were deferred in long-
term debt in the Consolidated Balance Sheet and were
being amortized against interest expense over the remaining life of the underlying debt that matured in July 2008. Approximately $0.3, $0.5,
and $0.5 million of the deferred gain was amortized against interest expense during fiscal years 2009, 2008 and 2007, respectively, resulting in
the deferred gain being fully amortized at June 30, 2009.
Tabular Presentation:
The following table presents information about the Company's debt obligations and derivative financial instruments that are sensitive to
changes in interest rates. For fixed rate debt obligations, the table presents principal amounts and related weighted-average interest rates by
fiscal year of maturity. For variable rate obligations, the table presents principal amounts and the weighted-average forward LIBOR interest
rates as of June 30, 2010 through June 30, 2015. For the Company's derivative financial instruments, the table presents notional amounts and
weighted-average interest rates by expected (contractual) maturity dates. Notional amounts are used to calculate the contractual payments to be
exchanged under the contract.
72
Expected maturity date as of June 30, 2010 June 30, 2010 June 30,
2009
2011 2012 2013 2014 2015 Thereafter Total
Fair Value
Fair Value
Liabilities
(U.S.$
equivalent
in
thousands)
Long
-term
debt:
Fixed rate
(U.S.$)
$
51,629
$
30,834
$
27,978
$
172,440
$
18,577
$
53,571
$
355,029
$
373,582
$
461,878
Average
interest
rate
6.9
%
7.7
%
7.6
%
5.3
%
7.6
%
7.5
%
6.4
%
Variable
rate
(U.S.$)
—
85,000
—
—
—
—
85,000
85,000
190,000
Average
interest
rate
2.9
%
Total
liabilities
$
51,629
$
115,834
$
27,978
$
172,440
$
18,577
$
53,571
$
440,029
$
458,582
$
651,878
Interest rate
derivatives
(U.S.$
equivalent
in
thousands)
Pay
fixed/receive
variable
(U.S.$)
$
—
$
40,000
$
—
$
—
$
—
$
—
$
40,000
$
1,039
$
5,786
Average
pay
rate**
3.2
%
Average
receive
rate**
0.4
%
**
Represents the average expected cost of borrowing for outstanding derivative balances as of June 30, 2010.