Supercuts 2010 Annual Report Download - page 36
Download and view the complete annual report
Please find page 36 of the 2010 Supercuts annual report below. You can navigate through the pages in the report by either clicking on the pages listed below, or by using the keyword search tool below to find specific information within the annual report.-
 1
1 -
2
-
3
-
4
-
5
-
6
-
7
-
8
-
9
-
10
-
11
-
12
-
13
-
14
-
15
-
16
-
17
-
18
-
19
-
20
-
21
-
22
-
23
-
24
-
25
-
 26
26 -
 27
27 -
 28
28 -
 29
29 -
 30
30 -
 31
31 -
 32
32 -
 33
33 -
 34
34 -
 35
35 -
 36
36 -
 37
37 -
 38
38 -
 39
39 -
 40
40 -
 41
41 -
 42
42 -
 43
43 -
 44
44 -
 45
45 -
 46
46 -
47
-
48
-
49
-
50
-
51
-
52
-
53
-
54
-
55
-
56
-
57
-
58
-
59
-
60
-
61
-
62
-
63
-
64
-
65
-
66
-
67
-
68
-
69
-
70
-
71
-
72
-
73
-
74
-
75
-
76
-
77
-
78
-
79
-
80
-
81
-
82
-
83
-
84
-
85
-
86
-
87
-
88
-
89
-
90
-
91
-
92
-
93
-
94
-
95
-
96
-
97
-
98
-
99
-
100
-
101
-
102
-
103
-
104
-
105
-
106
-
107
-
108
-
109
-
110
-
111
-
112
-
113
-
114
-
115
-
116
-
117
-
118
-
119
-
120
-
121
-
122
-
123
-
124
-
125
-
126
-
127
-
128
-
129
-
130
-
131
-
132
-
133
-
134
-
135
-
136
-
137
-
138
-
139
-
140
-
141
-
142
-
143
-
144
-
145
-
146
-
147
-
148
-
149
-
150
-
151
-
152
-
153
-
154
-
155
-
156
-
157
-
158
-
159
-
160
-
161
-
162
-
163
-
164
-
165
-
166
-
167
-
168
-
169
-
170
-
171
-
172
-
173
-
174
-
175
-
176
-
177
-
178
-
179
-
180
-
181
-
182
-
183
-
184
-
185
-
186
-
187
-
188
-
189
-
190
-
191
-
192
-
193
-
194
-
195
-
196
-
197
-
198
-
199
-
200
-
201
-
202
-
203
-
204
-
205
-
206
-
207
-
208
-
209
-
210
-
211
-
212
-
213
-
214
-
215
-
216
-
217
-
218
-
219
-
220
-
221
 |
 |

Table of Contents
reporting unit is based on the assets and liabilities associated with the operations of the reporting unit, including allocation of shared or
corporate balances among reporting units. Allocations are generally based on the number of salons in each reporting unit as a percent of total
company-owned salons.
The Company calculates the estimated fair value of the reporting units based on discounted future cash flows that utilize estimates in
annual revenue, gross margins, fixed expense rates, allocated corporate overhead, and long-term growth for determining terminal value. The
Company's estimated future cash flows also take into consideration acquisition integration and maturation. Where available and as appropriate,
comparative market multiples are used to corroborate the results of the discounted cash flow. The Company considers its various concepts to be
reporting units when testing for goodwill impairment because that is where the Company believes the goodwill resides. The Company
periodically engage third-party valuation consultants to assist in evaluation of the Company's estimated fair value calculations. The Company's
policy is to perform its annual goodwill impairment test during its third quarter of each fiscal year ending June 30.
In the situations where a reporting unit's carrying value exceeds its estimated fair value, the amount of the impairment loss must be
measured. The measurement of impairment is calculated by determining the implied fair value of a reporting unit's goodwill. In calculating the
implied fair value of goodwill, the fair value of the reporting unit is allocated to all other assets and liabilities of that unit based on the relative
fair values. The excess of the fair value of the reporting unit over the amount assigned to its assets and liabilities is the implied fair value of
goodwill. The goodwill impairment is measured as the excess of the carrying value of goodwill over its implied fair value.
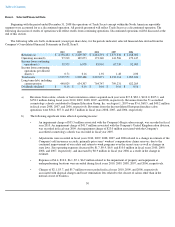
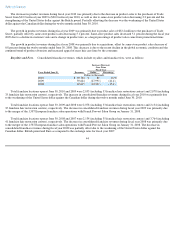
As a result of the Company's annual impairment analysis of goodwill during the third quarter of fiscal year 2010, a $35.3 million
impairment charge was recorded within continuing operations for the excess of the carrying value of goodwill over the implied fair value of
goodwill for the Regis salon concept.
As it is reasonably likely that there could be additional impairment of the Regis salon concept's goodwill in future periods along with the
sensitivity of the Company's critical assumptions in estimating fair value of this reporting unit, the Company has provided additional
information related to this reporting unit.
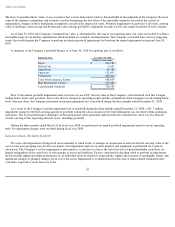
A summary of the critical assumptions utilized during the annual impairment test of the Regis salon concept as of March 31, 2010 are
outlined below:
Annual revenue growth. Annual revenue growth is primarily driven by assumed same-
store sales rates of negative 3.2 percent to
positive 3.0 percent. Other considerations include anticipated negative economic conditions in the short-term and moderate acquisition
growth.
Gross margin. Adjusted for anticipated salon closures, new salon construction and acquisitions, estimated future gross margins
were held constant.
Fixed expense rates. Fixed expense rate increases of approximately 1.5 to 2.0 percent based on anticipated inflation. Fixed
expenses consisted of rent, site operating, and allocated general and administrative corporate overhead.
Allocated corporate overhead. Corporate overhead incurred by the home office based on the number of Regis company-owned
salons as a percent of total company-owned salons.
Long-term growth. A long-term growth rate of 2.5 percent was applied to terminal cash flow based on anticipated economic
conditions.
Discount rate.
A discount rate of 12.0 percent based of the weighted average cost of capital that equals the rate of return on debt
capital and equity capital weighted in proportion to the capital structure common to the industry.
34