Supercuts 2010 Annual Report Download - page 45
Download and view the complete annual report
Please find page 45 of the 2010 Supercuts annual report below. You can navigate through the pages in the report by either clicking on the pages listed below, or by using the keyword search tool below to find specific information within the annual report.-
 1
1 -
2
-
3
-
4
-
5
-
6
-
7
-
8
-
9
-
10
-
11
-
12
-
13
-
14
-
15
-
16
-
17
-
18
-
19
-
20
-
21
-
22
-
23
-
24
-
25
-
26
-
27
-
28
-
29
-
30
-
31
-
32
-
33
-
34
-
 35
35 -
 36
36 -
 37
37 -
 38
38 -
 39
39 -
 40
40 -
 41
41 -
 42
42 -
 43
43 -
 44
44 -
 45
45 -
 46
46 -
 47
47 -
 48
48 -
 49
49 -
 50
50 -
 51
51 -
 52
52 -
 53
53 -
 54
54 -
 55
55 -
56
-
57
-
58
-
59
-
60
-
61
-
62
-
63
-
64
-
65
-
66
-
67
-
68
-
69
-
70
-
71
-
72
-
73
-
74
-
75
-
76
-
77
-
78
-
79
-
80
-
81
-
82
-
83
-
84
-
85
-
86
-
87
-
88
-
89
-
90
-
91
-
92
-
93
-
94
-
95
-
96
-
97
-
98
-
99
-
100
-
101
-
102
-
103
-
104
-
105
-
106
-
107
-
108
-
109
-
110
-
111
-
112
-
113
-
114
-
115
-
116
-
117
-
118
-
119
-
120
-
121
-
122
-
123
-
124
-
125
-
126
-
127
-
128
-
129
-
130
-
131
-
132
-
133
-
134
-
135
-
136
-
137
-
138
-
139
-
140
-
141
-
142
-
143
-
144
-
145
-
146
-
147
-
148
-
149
-
150
-
151
-
152
-
153
-
154
-
155
-
156
-
157
-
158
-
159
-
160
-
161
-
162
-
163
-
164
-
165
-
166
-
167
-
168
-
169
-
170
-
171
-
172
-
173
-
174
-
175
-
176
-
177
-
178
-
179
-
180
-
181
-
182
-
183
-
184
-
185
-
186
-
187
-
188
-
189
-
190
-
191
-
192
-
193
-
194
-
195
-
196
-
197
-
198
-
199
-
200
-
201
-
202
-
203
-
204
-
205
-
206
-
207
-
208
-
209
-
210
-
211
-
212
-
213
-
214
-
215
-
216
-
217
-
218
-
219
-
220
-
221
 |
 |

Table of Contents
sales of 1.5 percent. We closed 281 and 264 salons (including 51 and 103 franchise salons) during the twelve months ended June 30, 2009 and
2008, respectively
During fiscal year 2010, the foreign currency impact was driven by the weakening of the United States dollar against the Canadian dollar,
partially offset by the strengthening of the United Stated dollar against the British pound and Euro as compared to the prior fiscal year's
exchange rates. During fiscal years 2009 and 2008, the foreign currency impact was driven by the strengthening of the United States dollar
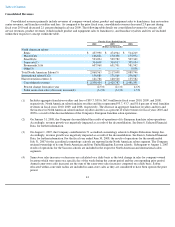
against the Canadian dollar, British pound, and Euro as compared to the prior fiscal year's exchange rates. Consolidated revenues are primarily
composed of service and product revenues, as well as franchise royalties and fees. Fluctuations in these three major revenue categories were as
follows:
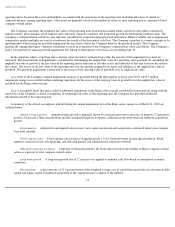
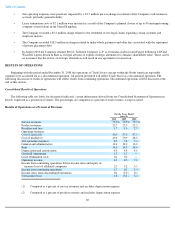
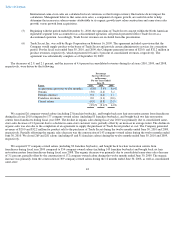
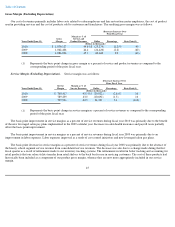
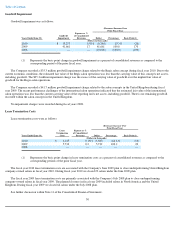
Service Revenues. Service revenues include revenues generated from company-owned salons and service revenues generated by hair
restoration centers. Consolidated service revenues were as follows:
The decrease in service revenues during fiscal year 2010 was due to same-store service sales decreasing 3.4 percent, as many consumers
have continued to lengthen their visitation pattern due to the economy. In addition, service revenues decreased due to the strengthening of the
United States dollar against the British pound. Partially offsetting the decrease was growth due to acquisitions during the twelve months and
the weakening of the United States dollar against the Canadian dollar during the twelve months ended June 30, 2010.
The decrease in service revenues during fiscal year 2009 was due to same-store service sales decreasing 2.5 percent. Same-store service
sales decreased 2.5 percent due to a decline in customer visits. Service revenues were also negatively impacted due to the strengthening of the
United States dollar against the Canadian dollar, British pound, and Euro and the deconsolidation of the European franchise salon operations on
January 31, 2008. Partially offsetting the decrease was growth due to acquisitions during the twelve months and an increase in average ticket.
The growth in service revenues during fiscal year 2008 was driven by acquisitions and new salon construction (a component of organic
growth). Service revenue growth was driven by a consolidated same-store service sales increase of 2.2 percent during the twelve months ended
June 30, 2008 as a result of price increases. Growth was negatively impacted as a result of the deconsolidation of our 51 accredited
cosmetology schools to Empire Education Group, Inc. on August 31, 2007.
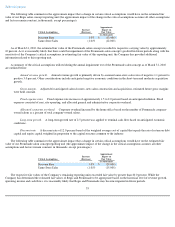
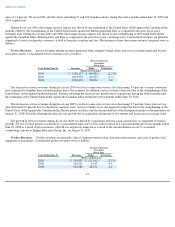
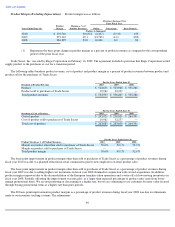
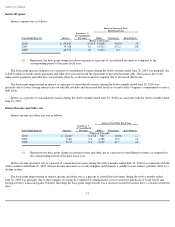
Product Revenues. Product revenues are primarily sales at company-owned salons, hair restoration centers, and sales of product and
equipment to franchisees. Consolidated product revenues were as follows:
43
(Decrease) Increase
Over Prior
Fiscal Year
Years Ended June 30, Revenues Dollar Percentage
(Dollars in thousands)
2010
$
1,784,137
$
(49,821
)
(2.7
)%
2009
1,833,958
(28,532
)
(1.5
)
2008
1,862,490
98,010
5.6
(Decrease) Increase
Over Prior
Fiscal Year
Years Ended June 30, Revenues Dollar Percentage
(Dollars in thousands)
2010
$
534,593
$
(21,612
)
(3.9
)%
2009
556,205
4,919
0.9
2008
551,286
22,374
4.2