Supercuts 2010 Annual Report Download - page 63
Download and view the complete annual report
Please find page 63 of the 2010 Supercuts annual report below. You can navigate through the pages in the report by either clicking on the pages listed below, or by using the keyword search tool below to find specific information within the annual report.-
 1
1 -
2
-
3
-
4
-
5
-
6
-
7
-
8
-
9
-
10
-
11
-
12
-
13
-
14
-
15
-
16
-
17
-
18
-
19
-
20
-
21
-
22
-
23
-
24
-
25
-
26
-
27
-
28
-
29
-
30
-
31
-
32
-
33
-
34
-
35
-
36
-
37
-
38
-
39
-
40
-
41
-
42
-
43
-
44
-
45
-
46
-
47
-
48
-
49
-
50
-
51
-
52
-
 53
53 -
 54
54 -
 55
55 -
 56
56 -
 57
57 -
 58
58 -
 59
59 -
 60
60 -
 61
61 -
 62
62 -
 63
63 -
 64
64 -
 65
65 -
 66
66 -
 67
67 -
 68
68 -
 69
69 -
 70
70 -
 71
71 -
 72
72 -
 73
73 -
74
-
75
-
76
-
77
-
78
-
79
-
80
-
81
-
82
-
83
-
84
-
85
-
86
-
87
-
88
-
89
-
90
-
91
-
92
-
93
-
94
-
95
-
96
-
97
-
98
-
99
-
100
-
101
-
102
-
103
-
104
-
105
-
106
-
107
-
108
-
109
-
110
-
111
-
112
-
113
-
114
-
115
-
116
-
117
-
118
-
119
-
120
-
121
-
122
-
123
-
124
-
125
-
126
-
127
-
128
-
129
-
130
-
131
-
132
-
133
-
134
-
135
-
136
-
137
-
138
-
139
-
140
-
141
-
142
-
143
-
144
-
145
-
146
-
147
-
148
-
149
-
150
-
151
-
152
-
153
-
154
-
155
-
156
-
157
-
158
-
159
-
160
-
161
-
162
-
163
-
164
-
165
-
166
-
167
-
168
-
169
-
170
-
171
-
172
-
173
-
174
-
175
-
176
-
177
-
178
-
179
-
180
-
181
-
182
-
183
-
184
-
185
-
186
-
187
-
188
-
189
-
190
-
191
-
192
-
193
-
194
-
195
-
196
-
197
-
198
-
199
-
200
-
201
-
202
-
203
-
204
-
205
-
206
-
207
-
208
-
209
-
210
-
211
-
212
-
213
-
214
-
215
-
216
-
217
-
218
-
219
-
220
-
221
 |
 |

Table of Contents
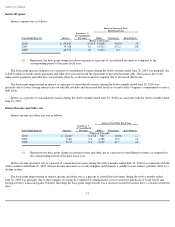
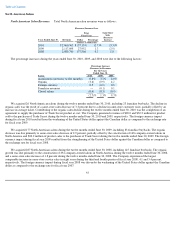
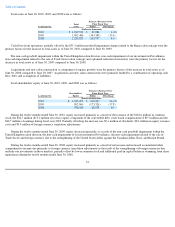
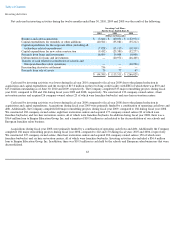
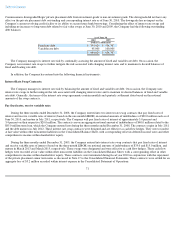
Total assets at June 30, 2010, 2009, and 2008 were as follows:
Cash flows from operations, partially offset by the $35.3 million goodwill impairment charge related to the Regis salon concept were the
primary factors for the increase in total assets as of June 30, 2010 compared to June 30, 2009.
The non-cash goodwill impairment within the United Kingdom salon division, non-cash impairment of our investment in Provalliance,
non-cash impairment related to the sale of Trade Secret salon concept, and a planned reduction in inventory were the primary factors for the
decrease in total assets as of June 30, 2009 compared to June 30, 2008.
Acquisitions and new salon construction (a component of organic growth) were the primary drivers of the increase in total assets as of
June 30, 2008 compared to June 30, 2007. Acquisitions and new salon construction were primarily funded by a combination of operating cash
flow, debt, and assumption of liabilities.
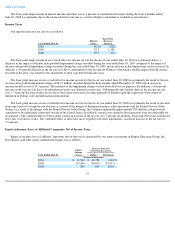
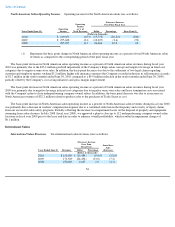
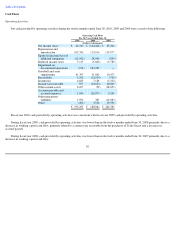
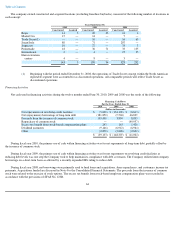
Total shareholders' equity at June 30, 2010, 2009, and 2008 was as follows:
During the twelve months ended June 30, 2010, equity increased primarily as a result of the issuance of the $163.6 million in common
stock, the $24.7 million ($15.2 million net of tax) equity component of the convertible debt, stock based compensation of $9.3 million and the
$42.7 million of earnings during fiscal year 2010. Partially offsetting the increase was $9.1 million of dividends, $8.2 million in equity issuance
costs and $5.4 million of foreign currency translation adjustments.
During the twelve months ended June 30, 2009, equity decreased primarily as a result of the non-cash goodwill impairment within the
United Kingdom salon division, the non-cash impairment of our investment in Provalliance, the non-cash impairment related to the sale of
Trade Secret and foreign currency due to the strengthening of the United States dollar against the Canadian dollar, Euro, and British Pound.
During the twelve months ended June 30, 2008, equity increased primarily as a result of net income and increased accumulated other
comprehensive income due primarily to foreign currency translation adjustments as the result of the strengthening of foreign currencies that
underlie our investments in those markets, partially offset by lower common stock and additional paid-in capital balances stemming from share
repurchases during the twelve months ended June 30, 2008.
61
Increase (Decrease) Over
Prior Fiscal Year
Total
Assets
As of June 30, Dollar Percentage
(Dollars in thousands)
2010
$
1,919,572
$
27,086
1.4
%
2009
1,892,486
(343,385
)
(15.4
)
2008
2,235,871
103,757
4.9
(Decrease) Increase Over
Prior Fiscal Year
Shareholders'
Equity
As of June 30, Dollar Percentage
(Dollars in thousands)
2010
$
1,013,293
$
210,433
26.2
%
2009
802,860
(173,326
)
(17.8
)
2008
976,186
62,878
6.9