Supercuts 2010 Annual Report Download - page 205
Download and view the complete annual report
Please find page 205 of the 2010 Supercuts annual report below. You can navigate through the pages in the report by either clicking on the pages listed below, or by using the keyword search tool below to find specific information within the annual report.-
 1
1 -
2
-
3
-
4
-
5
-
6
-
7
-
8
-
9
-
10
-
11
-
12
-
13
-
14
-
15
-
16
-
17
-
18
-
19
-
20
-
21
-
22
-
23
-
24
-
25
-
26
-
27
-
28
-
29
-
30
-
31
-
32
-
33
-
34
-
35
-
36
-
37
-
38
-
39
-
40
-
41
-
42
-
43
-
44
-
45
-
46
-
47
-
48
-
49
-
50
-
51
-
52
-
53
-
54
-
55
-
56
-
57
-
58
-
59
-
60
-
61
-
62
-
63
-
64
-
65
-
66
-
67
-
68
-
69
-
70
-
71
-
72
-
73
-
74
-
75
-
76
-
77
-
78
-
79
-
80
-
81
-
82
-
83
-
84
-
85
-
86
-
87
-
88
-
89
-
90
-
91
-
92
-
93
-
94
-
95
-
96
-
97
-
98
-
99
-
100
-
101
-
102
-
103
-
104
-
105
-
106
-
107
-
108
-
109
-
110
-
111
-
112
-
113
-
114
-
115
-
116
-
117
-
118
-
119
-
120
-
121
-
122
-
123
-
124
-
125
-
126
-
127
-
128
-
129
-
130
-
131
-
132
-
133
-
134
-
135
-
136
-
137
-
138
-
139
-
140
-
141
-
142
-
143
-
144
-
145
-
146
-
147
-
148
-
149
-
150
-
151
-
152
-
153
-
154
-
155
-
156
-
157
-
158
-
159
-
160
-
161
-
162
-
163
-
164
-
165
-
166
-
167
-
168
-
169
-
170
-
171
-
172
-
173
-
174
-
175
-
176
-
177
-
178
-
179
-
180
-
181
-
182
-
183
-
184
-
185
-
186
-
187
-
188
-
189
-
190
-
191
-
192
-
193
-
194
-
 195
195 -
 196
196 -
 197
197 -
 198
198 -
 199
199 -
 200
200 -
 201
201 -
 202
202 -
 203
203 -
 204
204 -
 205
205 -
 206
206 -
 207
207 -
 208
208 -
 209
209 -
 210
210 -
 211
211 -
 212
212 -
 213
213 -
 214
214 -
 215
215 -
216
-
217
-
218
-
219
-
220
-
221
 |
 |

PROVALLIANCE SAS
CONSOLIDATED FINANCIAL STATEMETS
DECEMBER 31, 2009 AND 2008
NOTES TO THE CONSOLIDATED FINANCIAL STATEMENTS (Continued)
(INFORMATION AS OF DECEMBER 31, 2009 AND FOR THE YEAR THEN ENDED NOT
COVERED BY AUDITORS' REPORT INCLUDED HEREIN)
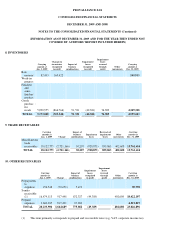
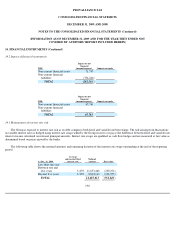
17. TRADE AND OTHER PAYABLES
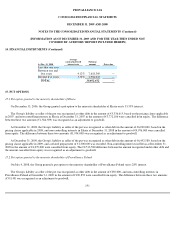
18. REVENUE
In 2009 and 2008 the Group's revenue broke down as follows by business segment:
Revenue broke down as follows by geographical segment:
193
At Dec. 31, 2009 At Dec. 31, 2008 Year-on-year
change
Miscellaneous trade payables
20,388,185
21,682,229
(1,294,044
)
Due to suppliers of non
-
current assets
245,158
383,192
(138,034
)
Total trade payables
20,633,343
22,065,421
(1,432,078
)
Customer prepayments
35,957
31,528
4,429
Accrued taxes and payroll costs
28,093,495
27,515,401
578,094
Miscellaneous other payables
2,568,288
6,160,005
(3,591,717
)
Deferred income
Total other payables
30,697,740
33,706,934
(3,009,194
)
TOTAL TRADE AND OTHER PAYABLES
51,331,083
55,772,355
(4,441,272
)
(in € thousands)
2009 2008
Year-on-year
change
(amount)
Year-on-year
change
(%)
Salons
151,784
134,260
17,524
13.1
%
Franchises
47,615
51,538
(3,923
)
(7.6
)%
Licenses
3,582
3,386
196
5.8
%
Total revenue
202,981
189,184
13,797
7.3
%
(in € thousands)
2009 2008
Year-on-year
change
(amount)
Year-on-year
change
(%)
France
171,493
163,762
7,731
4.7
%
Spain
9,870
7,804
2,066
26.5
%
Portugal
4,564
3,761
803
21.4
%
Poland
5,661
2,537
3,124
123.1
%
Luxembourg
10,841
10,786
55
0.5
%
Switzerland
552
534
18
3.4
%
Total revenue
202,981
189,184
13,797
7.3
%