Supercuts 2010 Annual Report Download - page 21
Download and view the complete annual report
Please find page 21 of the 2010 Supercuts annual report below. You can navigate through the pages in the report by either clicking on the pages listed below, or by using the keyword search tool below to find specific information within the annual report.-
 1
1 -
2
-
3
-
4
-
5
-
6
-
7
-
8
-
9
-
10
-
 11
11 -
 12
12 -
 13
13 -
 14
14 -
 15
15 -
 16
16 -
 17
17 -
 18
18 -
 19
19 -
 20
20 -
 21
21 -
 22
22 -
 23
23 -
 24
24 -
 25
25 -
 26
26 -
 27
27 -
 28
28 -
 29
29 -
 30
30 -
 31
31 -
32
-
33
-
34
-
35
-
36
-
37
-
38
-
39
-
40
-
41
-
42
-
43
-
44
-
45
-
46
-
47
-
48
-
49
-
50
-
51
-
52
-
53
-
54
-
55
-
56
-
57
-
58
-
59
-
60
-
61
-
62
-
63
-
64
-
65
-
66
-
67
-
68
-
69
-
70
-
71
-
72
-
73
-
74
-
75
-
76
-
77
-
78
-
79
-
80
-
81
-
82
-
83
-
84
-
85
-
86
-
87
-
88
-
89
-
90
-
91
-
92
-
93
-
94
-
95
-
96
-
97
-
98
-
99
-
100
-
101
-
102
-
103
-
104
-
105
-
106
-
107
-
108
-
109
-
110
-
111
-
112
-
113
-
114
-
115
-
116
-
117
-
118
-
119
-
120
-
121
-
122
-
123
-
124
-
125
-
126
-
127
-
128
-
129
-
130
-
131
-
132
-
133
-
134
-
135
-
136
-
137
-
138
-
139
-
140
-
141
-
142
-
143
-
144
-
145
-
146
-
147
-
148
-
149
-
150
-
151
-
152
-
153
-
154
-
155
-
156
-
157
-
158
-
159
-
160
-
161
-
162
-
163
-
164
-
165
-
166
-
167
-
168
-
169
-
170
-
171
-
172
-
173
-
174
-
175
-
176
-
177
-
178
-
179
-
180
-
181
-
182
-
183
-
184
-
185
-
186
-
187
-
188
-
189
-
190
-
191
-
192
-
193
-
194
-
195
-
196
-
197
-
198
-
199
-
200
-
201
-
202
-
203
-
204
-
205
-
206
-
207
-
208
-
209
-
210
-
211
-
212
-
213
-
214
-
215
-
216
-
217
-
218
-
219
-
220
-
221
 |
 |

Table of Contents
infrastructure, recruitment of experienced hair care management and adequate store staff, and leasing of quality sites. The principal factors of
competition in the affordable hair care category are quality, consistency and convenience. The Company continually strives to improve its
performance in each of these areas and to create additional points of differentiation versus the competition. In order to obtain locations in
shopping malls, the Company must be competitive as to rentals and other customary tenant obligations.
Hair Restoration Business Strategy:
In December 2004, the Company acquired Hair Club for Men and Women (Hair Club), the largest U.S. provider of hair loss solutions and
the only company offering a comprehensive menu of proven hair loss products and services. The Company leverages its strong brand, best-in-
class service model and comprehensive menu of hair restoration alternatives to build an increasing base of repeat customers that generate
recurring cash flow for the Company. From its traditional non-surgical hair replacement systems, to hair transplants, hair therapies and hair
care products and services, Hair Club offers a solution for anyone experiencing or anticipating hair loss. The Company's operations consist of
95 locations (33 franchise locations) in the United States and Canada. The domestic hair restoration market is estimated to generate over
$4 billion annually. The competitive landscape is highly fragmented and comprised of approximately 4,000 locations. Hair Club and its
franchisees have the largest market share, with approximately five percent based on customer count.
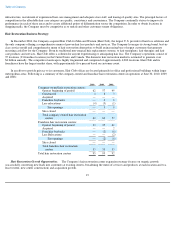
In an effort to provide privacy to its customers, Hair Club offices are located primarily in office and professional buildings within larger
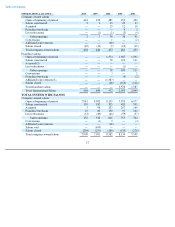
metropolitan areas. Following is a summary of the company-owned and franchise hair restoration centers in operation at June 30, 2010, 2009,
and 2008:
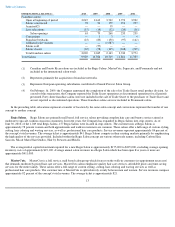
Hair Restoration Growth Opportunities. The Company's hair restoration center expansion strategy focuses on organic growth
(successfully converting new leads into customers at existing centers, broadening the menu of services and products at each location and to a
lesser extent, new center construction) and acquisition growth.
19
2010 2009 2008
Company
-
owned hair restoration centers:
Open at beginning of period
62
57
49
Constructed
4
8
3
Acquired
—
—
—
Franchise buybacks
—
2
6
Less relocations
(4
)
(5
)
(1
)
Site openings
—
5
8
Sites closed
—
—
—
Total company-
owned hair restoration
centers
62
62
57
Franchise hair restoration centers:
Open at beginning of period
33
35
41
Acquired
—
—
2
Franchise buybacks
—
(
2
)
(6
)
Less Relocations
—
—
(
2
)
Site openings
—
(
2
)
(6
)
Sites closed
—
—
—
Total franchise hair restoration
centers
33
33
35
Total hair restoration centers
95
95
92