Supercuts 2010 Annual Report Download - page 32
Download and view the complete annual report
Please find page 32 of the 2010 Supercuts annual report below. You can navigate through the pages in the report by either clicking on the pages listed below, or by using the keyword search tool below to find specific information within the annual report.-
 1
1 -
2
-
3
-
4
-
5
-
6
-
7
-
8
-
9
-
10
-
11
-
12
-
13
-
14
-
15
-
16
-
17
-
18
-
19
-
20
-
21
-
 22
22 -
 23
23 -
 24
24 -
 25
25 -
 26
26 -
 27
27 -
 28
28 -
 29
29 -
 30
30 -
 31
31 -
 32
32 -
 33
33 -
 34
34 -
 35
35 -
 36
36 -
 37
37 -
 38
38 -
 39
39 -
 40
40 -
 41
41 -
 42
42 -
43
-
44
-
45
-
46
-
47
-
48
-
49
-
50
-
51
-
52
-
53
-
54
-
55
-
56
-
57
-
58
-
59
-
60
-
61
-
62
-
63
-
64
-
65
-
66
-
67
-
68
-
69
-
70
-
71
-
72
-
73
-
74
-
75
-
76
-
77
-
78
-
79
-
80
-
81
-
82
-
83
-
84
-
85
-
86
-
87
-
88
-
89
-
90
-
91
-
92
-
93
-
94
-
95
-
96
-
97
-
98
-
99
-
100
-
101
-
102
-
103
-
104
-
105
-
106
-
107
-
108
-
109
-
110
-
111
-
112
-
113
-
114
-
115
-
116
-
117
-
118
-
119
-
120
-
121
-
122
-
123
-
124
-
125
-
126
-
127
-
128
-
129
-
130
-
131
-
132
-
133
-
134
-
135
-
136
-
137
-
138
-
139
-
140
-
141
-
142
-
143
-
144
-
145
-
146
-
147
-
148
-
149
-
150
-
151
-
152
-
153
-
154
-
155
-
156
-
157
-
158
-
159
-
160
-
161
-
162
-
163
-
164
-
165
-
166
-
167
-
168
-
169
-
170
-
171
-
172
-
173
-
174
-
175
-
176
-
177
-
178
-
179
-
180
-
181
-
182
-
183
-
184
-
185
-
186
-
187
-
188
-
189
-
190
-
191
-
192
-
193
-
194
-
195
-
196
-
197
-
198
-
199
-
200
-
201
-
202
-
203
-
204
-
205
-
206
-
207
-
208
-
209
-
210
-
211
-
212
-
213
-
214
-
215
-
216
-
217
-
218
-
219
-
220
-
221
 |
 |

Table of Contents
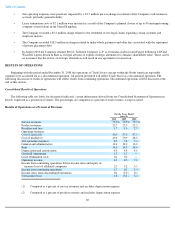
Item 6. Selected Financial Data
Beginning with the period ended December 31, 2008 the operations of Trade Secret concept within the North American reportable
segment were accounted for as a discontinued operation. All periods presented will reflect Trade Secret as a discontinued operation. The
following discussion of results of operations will reflect results from continuing operations. Discontinued operations will be discussed at the
end of this section.
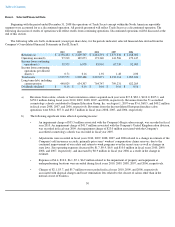
The following table sets forth, in thousands (except per share data), for the periods indicated, selected financial data derived from the
Company's Consolidated Financial Statements in Part II, Item 8.
30
2010 2009 2008 2007 2006
Revenues(a)
$
2,358,434
$
2,429,787
$
2,481,391
$
2,373,338
$
2,168,002
Operating income(b)
97,218
109,073
173,340
141,506
179,147
Income from continuing
operations(c)
39,579
6,970
83,901
67,739
92,903
Income from continuing
operations per diluted
share(c)
0.71
0.16
1.92
1.48
2.00
Total assets
1,919,572
1,892,486
2,235,871
2,132,114
1,985,324
Long-term debt, including
current portion
440,029
634,307
764,747
709,231
622,269
Dividends declared
$
0.16
$
0.16
$
0.16
$
0.16
$
0.16
a) Revenues from salons, schools or hair restorations centers acquired each year were $17.8, $82.1, $110.0, $105.1, and
$158.3 million during fiscal years 2010, 2009, 2008, 2007, and 2006, respectively. Revenues from the 51 accredited
cosmetology schools contributed to Empire Education Group, Inc. on August 1, 2007 were $5.6, $68.5, and $48.2 million
in fiscal years 2008, 2007, and 2006, respectively. Revenues from the deconsolidated European franchise salon
operations were $36.2, $57.0, and $52.7 million in fiscal years 2008, 2007, and 2006, respectively.
b) The following significant items affected operating income:
•
An impairment charge of $35.3 million associated with the Company's Regis salon concept, was recorded in fiscal
year 2010. An impairment charge of $41.7 million associated with the Company's United Kingdom salon division,
was recorded in fiscal year 2009. An impairment charge of $23.0 million associated with the Company's
accredited cosmetology schools was recorded in fiscal year 2007.
•
Adjustments were recorded in fiscal years 2010, 2009, 2008, 2007, and 2006 related to a change in estimate of the
Company's self-insurance accruals, primarily prior years' workers' compensation claims reserves, due to the
continued improvement of our safety and return-to-work programs over the recent years as well as changes in
state laws. Site operating expenses decreased by $1.7, $9.9, $6.9, and $10.0 million in fiscal years 2010, 2009,
2008, and 2007, respectively, and increased by $0.9 million in fiscal year 2006 as a result in the change in
estimate.
• Expenses of $6.4, $10.2, $6.1, $5.1, $6.9 million related to the impairment of property and equipment at
underperforming locations were recorded during fiscal years 2010, 2009, 2008, 2007, and 2006, respectively.
• Charges of $2.1, $5.7, and $5.7 million were recorded in fiscal years 2010, 2009, and 2006, respectively
associated with disposal charges and lease termination fees related to the closure of salons other than in the
normal course of business.