Starwood 2004 Annual Report Download - page 82
Download and view the complete annual report
Please find page 82 of the 2004 Starwood annual report below. You can navigate through the pages in the report by either clicking on the pages listed below, or by using the keyword search tool below to find specific information within the annual report.-
 1
1 -
2
-
3
-
4
-
5
-
6
-
7
-
8
-
9
-
10
-
11
-
12
-
13
-
14
-
15
-
16
-
17
-
18
-
19
-
20
-
21
-
22
-
23
-
24
-
25
-
26
-
27
-
28
-
29
-
30
-
31
-
32
-
33
-
34
-
35
-
36
-
37
-
38
-
39
-
40
-
41
-
42
-
43
-
44
-
45
-
46
-
47
-
48
-
49
-
50
-
51
-
52
-
53
-
54
-
55
-
56
-
57
-
58
-
59
-
60
-
61
-
62
-
63
-
64
-
65
-
66
-
67
-
68
-
69
-
70
-
71
-
 72
72 -
 73
73 -
 74
74 -
 75
75 -
 76
76 -
 77
77 -
 78
78 -
 79
79 -
 80
80 -
 81
81 -
 82
82 -
 83
83 -
 84
84 -
 85
85 -
 86
86 -
 87
87 -
 88
88 -
 89
89 -
 90
90 -
 91
91 -
 92
92 -
93
-
94
-
95
-
96
-
97
-
98
-
99
-
100
-
101
-
102
-
103
-
104
-
105
-
106
-
107
-
108
-
109
-
110
-
111
-
112
-
113
-
114
-
115
-
116
-
117
-
118
-
119
-
120
-
121
-
122
-
123
-
124
-
125
-
126
-
127
-
128
-
129
-
130
-
131
-
132
-
133
-
134
-
135
-
136
-
137
-
138
-
139
 |
 |

STARWOOD HOTELS & RESORTS WORLDWIDE, INC.
AND STARWOOD HOTELS & RESORTS
NOTES TO FINANCIAL STATEMENTS Ì (Continued)
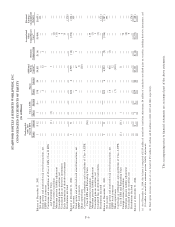
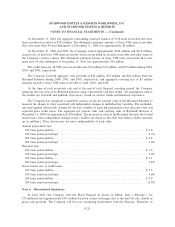
recognition provisions of SFAS No. 123, ""Accounting for Stock-Based Compensation,'' to stock-based
employee compensation:
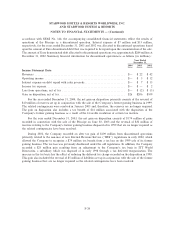
Year Ended December 31,
2004 2003 2002
(In millions, except per
Share data)
Net income, as reportedÏÏÏÏÏÏÏÏÏÏÏÏÏÏÏÏÏÏÏÏÏÏÏÏÏÏÏÏÏÏÏÏÏÏÏÏÏÏÏÏÏÏÏÏÏÏÏÏÏ $ 395 $ 309 $ 355
Deduct: SFAS No. 123 compensation cost ÏÏÏÏÏÏÏÏÏÏÏÏÏÏÏÏÏÏÏÏÏÏÏÏÏÏÏÏÏÏÏ (83) (75) (81)
Tax eÅectÏÏÏÏÏÏÏÏÏÏÏÏÏÏÏÏÏÏÏÏÏÏÏÏÏÏÏÏÏÏÏÏÏÏÏÏÏÏÏÏÏÏÏÏÏÏÏÏÏÏÏÏÏÏÏÏÏ 28 26 28
Proforma net income ÏÏÏÏÏÏÏÏÏÏÏÏÏÏÏÏÏÏÏÏÏÏÏÏÏÏÏÏÏÏÏÏÏÏÏÏÏÏÏÏÏÏÏÏÏÏÏÏÏ $ 340 $ 260 $ 302
Earnings per Share:
Basic, as reported ÏÏÏÏÏÏÏÏÏÏÏÏÏÏÏÏÏÏÏÏÏÏÏÏÏÏÏÏÏÏÏÏÏÏÏÏÏÏÏÏÏÏÏÏÏÏÏÏÏÏÏÏ $1.91 $1.53 $1.76
Basic, proforma ÏÏÏÏÏÏÏÏÏÏÏÏÏÏÏÏÏÏÏÏÏÏÏÏÏÏÏÏÏÏÏÏÏÏÏÏÏÏÏÏÏÏÏÏÏÏÏÏÏÏÏÏÏÏ $1.64 $1.28 $1.50
Diluted, as reported ÏÏÏÏÏÏÏÏÏÏÏÏÏÏÏÏÏÏÏÏÏÏÏÏÏÏÏÏÏÏÏÏÏÏÏÏÏÏÏÏÏÏÏÏÏÏÏÏÏÏ $1.84 $1.50 $1.73
Diluted, proforma ÏÏÏÏÏÏÏÏÏÏÏÏÏÏÏÏÏÏÏÏÏÏÏÏÏÏÏÏÏÏÏÏÏÏÏÏÏÏÏÏÏÏÏÏÏÏÏÏÏÏÏÏ $1.59 $1.26 $1.47
Average Black Scholes Assumptions:
Dividend Yield ÏÏÏÏÏÏÏÏÏÏÏÏÏÏÏÏÏÏÏÏÏÏÏÏÏÏÏÏÏÏÏÏÏÏÏÏÏÏÏÏÏÏÏÏÏÏÏÏÏÏÏÏÏÏ 2.5% 3.1% 2.7%
Volatility ÏÏÏÏÏÏÏÏÏÏÏÏÏÏÏÏÏÏÏÏÏÏÏÏÏÏÏÏÏÏÏÏÏÏÏÏÏÏÏÏÏÏÏÏÏÏÏÏÏÏÏÏÏÏÏÏÏÏÏ 42% 42% 41%
Risk-free rateÏÏÏÏÏÏÏÏÏÏÏÏÏÏÏÏÏÏÏÏÏÏÏÏÏÏÏÏÏÏÏÏÏÏÏÏÏÏÏÏÏÏÏÏÏÏÏÏÏÏÏÏÏÏÏÏ 3.2% 3.2% 3.2%
Expected life ÏÏÏÏÏÏÏÏÏÏÏÏÏÏÏÏÏÏÏÏÏÏÏÏÏÏÏÏÏÏÏÏÏÏÏÏÏÏÏÏÏÏÏÏÏÏÏÏÏÏÏÏÏÏÏÏ 6 yrs 6 yrs 6 yrs
The weighted average fair value per Share of options granted in 2004, 2003 and 2002 was $13.78, $8.48
and $10.01, respectively, using the assumptions noted in the table above. During the fourth quarter of 2004,
the Company determined that the calculation of its pro forma net income reported under SFAS No. 123 for
the years ended December 31, 2003 and 2002, as reported in those years, included errors in certain
assumptions used in the Black Scholes calculations, including the dividend yield and the expected lives of the
outstanding options. The errors were not material to the pro forma net income in either period. The pro forma
net income reported under SFAS No. 123 for the years ended December 31, 2003 and 2002 presented in the
table above have been revised, resulting in an increase in the previously reported amounts of $0.08 and
$0.09 per diluted share for 2003 and 2002, respectively. This revision had no eÅect on the Company's
previously reported consolidated results of operations or Ñnancial condition.
Revenue Recognition. The Company's revenues are primarily derived from the following sources:
(1) hotel and resort revenues at the Company's owned, leased and consolidated joint venture properties;
(2) management and franchise fees; (3) vacation ownership and residential revenues; (4) revenues from
managed and franchised properties; and (5) other revenues which are ancillary to the Company's operations.
Generally, revenues are recognized when the services have been rendered. The following is a description of the
composition of revenues for the Company:
¬Owned, Leased and Consolidated Joint Ventures Ì Represents revenue primarily derived from hotel
operations, including the rental of rooms and food and beverage sales, from owned, leased or
consolidated joint venture hotels and resorts. Revenue is recognized when rooms are occupied and
services have been rendered.
¬Management and Franchise Fees Ì Represents fees earned on hotels managed worldwide, usually
under long-term contracts, and franchise fees received in connection with the franchise of the
F-16