Starwood 2004 Annual Report Download - page 124
Download and view the complete annual report
Please find page 124 of the 2004 Starwood annual report below. You can navigate through the pages in the report by either clicking on the pages listed below, or by using the keyword search tool below to find specific information within the annual report.-
 1
1 -
2
-
3
-
4
-
5
-
6
-
7
-
8
-
9
-
10
-
11
-
12
-
13
-
14
-
15
-
16
-
17
-
18
-
19
-
20
-
21
-
22
-
23
-
24
-
25
-
26
-
27
-
28
-
29
-
30
-
31
-
32
-
33
-
34
-
35
-
36
-
37
-
38
-
39
-
40
-
41
-
42
-
43
-
44
-
45
-
46
-
47
-
48
-
49
-
50
-
51
-
52
-
53
-
54
-
55
-
56
-
57
-
58
-
59
-
60
-
61
-
62
-
63
-
64
-
65
-
66
-
67
-
68
-
69
-
70
-
71
-
72
-
73
-
74
-
75
-
76
-
77
-
78
-
79
-
80
-
81
-
82
-
83
-
84
-
85
-
86
-
87
-
88
-
89
-
90
-
91
-
92
-
93
-
94
-
95
-
96
-
97
-
98
-
99
-
100
-
101
-
102
-
103
-
104
-
105
-
106
-
107
-
108
-
109
-
110
-
111
-
112
-
113
-
 114
114 -
 115
115 -
 116
116 -
 117
117 -
 118
118 -
 119
119 -
 120
120 -
 121
121 -
 122
122 -
 123
123 -
 124
124 -
 125
125 -
 126
126 -
 127
127 -
 128
128 -
 129
129 -
 130
130 -
 131
131 -
 132
132 -
 133
133 -
 134
134 -
135
-
136
-
137
-
138
-
139
 |
 |

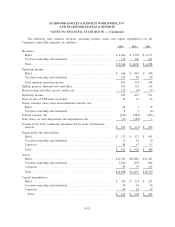
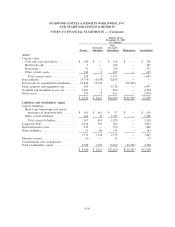
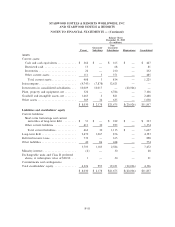
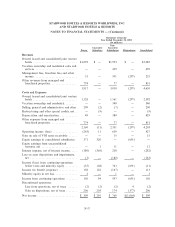
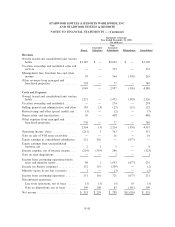
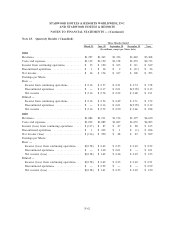
STARWOOD HOTELS & RESORTS WORLDWIDE, INC.
AND STARWOOD HOTELS & RESORTS
NOTES TO FINANCIAL STATEMENTS Ì (Continued)
Statement of Income
Year Ended December 31, 2002
(In millions)
Non-
Guarantor Guarantor
Parent Subsidiary Subsidiaries Eliminations Consolidated
Revenues
Owned, leased and consolidated joint venture
hotels ÏÏÏÏÏÏÏÏÏÏÏÏÏÏÏÏÏÏÏÏÏÏÏÏÏÏÏÏÏÏÏ $1,187 $ Ì $2,003 $ Ì $3,190
Vacation ownership and residential sales and
servicesÏÏÏÏÏÏÏÏÏÏÏÏÏÏÏÏÏÏÏÏÏÏÏÏÏÏÏÏÏÏ Ì Ì 353 Ì 353
Management fees, franchise fees and other
income ÏÏÏÏÏÏÏÏÏÏÏÏÏÏÏÏÏÏÏÏÏÏÏÏÏÏÏÏÏÏ 59 Ì 564 (358) 265
Other revenues from managed and
franchised propertiesÏÏÏÏÏÏÏÏÏÏÏÏÏÏÏÏÏÏÏ 703 Ì 77 Ì 780
1,949 Ì 2,997 (358) 4,588
Costs and Expenses
Owned, leased and consolidated joint venture
hotels ÏÏÏÏÏÏÏÏÏÏÏÏÏÏÏÏÏÏÏÏÏÏÏÏÏÏÏÏÏÏÏ 1,221 Ì 1,472 (343) 2,350
Vacation ownership and residentialÏÏÏÏÏÏÏÏÏ Ì Ì 274 Ì 274
Selling, general and administrative and other 195 (3) (25) (15) 152
Restructuring and other special credits, netÏÏ (5) Ì (2) Ì (7)
Depreciation and amortization ÏÏÏÏÏÏÏÏÏÏÏÏ 50 Ì 438 Ì 488
Other expenses from managed and
franchised propertiesÏÏÏÏÏÏÏÏÏÏÏÏÏÏÏÏÏÏÏ 703 Ì 77 Ì 780
2,164 (3) 2,234 (358) 4,037
Operating income (loss) ÏÏÏÏÏÏÏÏÏÏÏÏÏÏÏÏÏ (215) 3 763 Ì 551
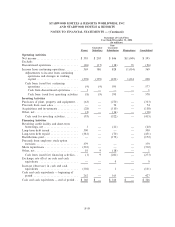
Gain on sale of VOI notes receivable ÏÏÏÏÏÏ Ì Ì 16 Ì 16
Equity earnings in consolidated subsidiaries 521 356 Ì (877) Ì
Equity earnings from unconsolidated
ventures, net ÏÏÏÏÏÏÏÏÏÏÏÏÏÏÏÏÏÏÏÏÏÏÏÏÏ 2 1 5 Ì 8
Interest expense, net of interest incomeÏÏÏÏÏ (210) (359) 246 Ì (323)
Gain on asset dispositions ÏÏÏÏÏÏÏÏÏÏÏÏÏÏÏÏ Ì Ì 3 Ì 3
Income from continuing operations before
taxes and minority equityÏÏÏÏÏÏÏÏÏÏÏÏÏÏÏ 98 1 1,033 (877) 255
Income tax beneÑt (expense) ÏÏÏÏÏÏÏÏÏÏÏÏÏ 152 155 (309) Ì (2)
Minority equity in net loss (income) ÏÏÏÏÏÏÏ 1 Ì (3) Ì (2)
Income from continuing operations ÏÏÏÏÏÏÏÏ 251 156 721 (877) 251
Discontinued operations:
Loss from operations, net of taxes ÏÏÏÏÏÏÏ (5) (5) (5) 10 (5)
Gain on dispositions, net of taxes ÏÏÏÏÏÏÏÏ 109 108 83 (191) 109
Net income ÏÏÏÏÏÏÏÏÏÏÏÏÏÏÏÏÏÏÏÏÏÏÏÏÏÏÏÏ $ 355 $ 259 $ 799 $(1,058) $ 355
F-58