Starwood 2004 Annual Report Download - page 31
Download and view the complete annual report
Please find page 31 of the 2004 Starwood annual report below. You can navigate through the pages in the report by either clicking on the pages listed below, or by using the keyword search tool below to find specific information within the annual report.-
 1
1 -
2
-
3
-
4
-
5
-
6
-
7
-
8
-
9
-
10
-
11
-
12
-
13
-
14
-
15
-
16
-
17
-
18
-
19
-
20
-
 21
21 -
 22
22 -
 23
23 -
 24
24 -
 25
25 -
 26
26 -
 27
27 -
 28
28 -
 29
29 -
 30
30 -
 31
31 -
 32
32 -
 33
33 -
 34
34 -
 35
35 -
 36
36 -
 37
37 -
 38
38 -
 39
39 -
 40
40 -
 41
41 -
42
-
43
-
44
-
45
-
46
-
47
-
48
-
49
-
50
-
51
-
52
-
53
-
54
-
55
-
56
-
57
-
58
-
59
-
60
-
61
-
62
-
63
-
64
-
65
-
66
-
67
-
68
-
69
-
70
-
71
-
72
-
73
-
74
-
75
-
76
-
77
-
78
-
79
-
80
-
81
-
82
-
83
-
84
-
85
-
86
-
87
-
88
-
89
-
90
-
91
-
92
-
93
-
94
-
95
-
96
-
97
-
98
-
99
-
100
-
101
-
102
-
103
-
104
-
105
-
106
-
107
-
108
-
109
-
110
-
111
-
112
-
113
-
114
-
115
-
116
-
117
-
118
-
119
-
120
-
121
-
122
-
123
-
124
-
125
-
126
-
127
-
128
-
129
-
130
-
131
-
132
-
133
-
134
-
135
-
136
-
137
-
138
-
139
 |
 |
$255 million and $201 million, respectively. A 10% reduction in the ""breakage'' of points would result in an
increase of $38 million to the liability at December 31, 2004.
Long-Lived Assets. We evaluate the carrying value of our long-lived assets for impairment by
comparing the expected undiscounted future cash Öows of the assets to the net book value of the assets if
certain trigger events occur. If the expected undiscounted future cash Öows are less than the net book value of
the assets, the excess of the net book value over the estimated fair value is charged to current earnings. Fair
value is based upon discounted cash Öows of the assets at a rate deemed reasonable for the type of asset and
prevailing market conditions, appraisals and, if appropriate, current estimated net sales proceeds from pending
oÅers. We evaluate the carrying value of our long-lived assets based on our plans, at the time, for such assets
and such qualitative factors as future development in the surrounding area, status of expected local
competition and projected incremental income from renovations. Changes to our plans, including a decision to
dispose of or change the intended use of an asset, can have a material impact on the carrying value of the
asset. When a decision is made to sell an asset, we do not record that asset as held for sale until all the criteria
in SFAS No. 144, ""Accounting for the Impairment or Disposal of Long-Lived Assets,'' have been met and we
have received a non-refundable deposit.
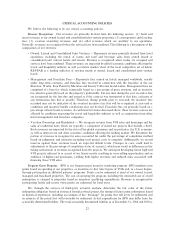
Legal Contingencies. We are subject to various legal proceedings and claims, the outcomes of which are
subject to signiÑcant uncertainty. SFAS No. 5, ""Accounting for Contingencies,'' requires that an estimated
loss from a loss contingency should be accrued by a charge to income if it is probable that an asset has been
impaired or a liability has been incurred and the amount of the loss can be reasonably estimated. We evaluate,
among other factors, the degree of probability of an unfavorable outcome and the ability to make a reasonable
estimate of the amount of loss and changes in these factors could materially impact our Ñnancial position or
our results of operations.
Income Taxes. We provide for income taxes in accordance with SFAS No. 109, ""Accounting for
Income Taxes.'' The objectives of accounting for income taxes are to recognize the amount of taxes payable or
refundable for the current year and deferred tax liabilities and assets for the future tax consequences of events
that have been recognized in an entity's Ñnancial statements or tax returns. Judgment is required in assessing
the future tax consequences of events that have been recognized in our Ñnancial statements or tax returns.
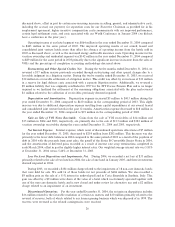
RESULTS OF OPERATIONS
The following discussion presents an analysis of results of our operations for the years ended Decem-
ber 31, 2004, 2003 and 2002.
Our operating results for 2004 improved signiÑcantly when compared to 2003 due, in large part, to the
continued economic recovery in the United States, particularly its eÅect on the hospitality industry. Our
operating results for a substantial part of 2003 were signiÑcantly impacted by the weakened worldwide
economic environment, the war in Iraq and its aftermath, and the Severe Acute Respiratory Syndrome
(""SARS'') epidemic, all of which resulted in a dramatic slowdown in business and international travel. In the
latter part of 2003 and continuing into 2004, transient travel in North America, where we have our largest
concentration of owned hotels, began to increase, more than oÅsetting the then weaknesses in group travel.
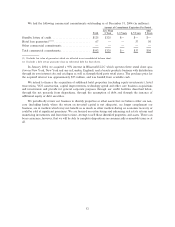
We derive the majority of our revenues and operating income from our owned, leased and consolidated
joint venture hotels and, as discussed above, a signiÑcant portion of these results are driven by these hotels in
North America. Total revenues generated from our hotels in North America for the years ending Decem-
ber 31, 2004 and 2003 were $2.423 billion and $2.285 billion, respectively (our worldwide owned, leased and
consolidated joint venture revenues were $3.326 billion and $3,085 billion for 2004 and 2003, respectively).
23