Starwood 2004 Annual Report Download - page 20
Download and view the complete annual report
Please find page 20 of the 2004 Starwood annual report below. You can navigate through the pages in the report by either clicking on the pages listed below, or by using the keyword search tool below to find specific information within the annual report.-
 1
1 -
2
-
3
-
4
-
5
-
6
-
7
-
8
-
9
-
 10
10 -
 11
11 -
 12
12 -
 13
13 -
 14
14 -
 15
15 -
 16
16 -
 17
17 -
 18
18 -
 19
19 -
 20
20 -
 21
21 -
 22
22 -
 23
23 -
 24
24 -
 25
25 -
 26
26 -
 27
27 -
 28
28 -
 29
29 -
 30
30 -
31
-
32
-
33
-
34
-
35
-
36
-
37
-
38
-
39
-
40
-
41
-
42
-
43
-
44
-
45
-
46
-
47
-
48
-
49
-
50
-
51
-
52
-
53
-
54
-
55
-
56
-
57
-
58
-
59
-
60
-
61
-
62
-
63
-
64
-
65
-
66
-
67
-
68
-
69
-
70
-
71
-
72
-
73
-
74
-
75
-
76
-
77
-
78
-
79
-
80
-
81
-
82
-
83
-
84
-
85
-
86
-
87
-
88
-
89
-
90
-
91
-
92
-
93
-
94
-
95
-
96
-
97
-
98
-
99
-
100
-
101
-
102
-
103
-
104
-
105
-
106
-
107
-
108
-
109
-
110
-
111
-
112
-
113
-
114
-
115
-
116
-
117
-
118
-
119
-
120
-
121
-
122
-
123
-
124
-
125
-
126
-
127
-
128
-
129
-
130
-
131
-
132
-
133
-
134
-
135
-
136
-
137
-
138
-
139
 |
 |

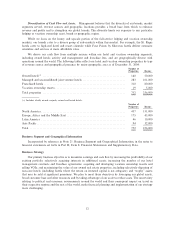
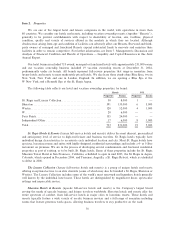
DiversiÑcation of Cash Flow and Assets. Management believes that the diversity of our brands, market
segments served, revenue sources and geographic locations provides a broad base from which to enhance
revenue and proÑts and to strengthen our global brands. This diversity limits our exposure to any particular
lodging or vacation ownership asset, brand or geographic region.
While we focus on the luxury and upscale portion of the full-service lodging and vacation ownership
markets, our brands cater to a diverse group of sub-markets within this market. For example, the St. Regis
hotels cater to high-end hotel and resort clientele while Four Points by Sheraton hotels deliver extensive
amenities and services at more aÅordable rates.
We derive our cash Öow from multiple sources within our hotel and vacation ownership segments,
including owned hotels activity and management and franchise fees, and are geographically diverse with
operations around the world. The following tables reÖect our hotel and vacation ownership properties by type
of revenue source and geographical presence by major geographic area as of December 31, 2004:
Number of
Properties Rooms
Owned hotels(a) ÏÏÏÏÏÏÏÏÏÏÏÏÏÏÏÏÏÏÏÏÏÏÏÏÏÏÏÏÏÏÏÏÏÏÏÏÏÏÏÏÏÏÏÏÏÏÏÏÏÏÏÏÏÏÏÏÏÏ 140 50,000
Managed and unconsolidated joint venture hotels ÏÏÏÏÏÏÏÏÏÏÏÏÏÏÏÏÏÏÏÏÏÏÏÏÏÏÏÏÏÏ 283 101,000
Franchised hotels ÏÏÏÏÏÏÏÏÏÏÏÏÏÏÏÏÏÏÏÏÏÏÏÏÏÏÏÏÏÏÏÏÏÏÏÏÏÏÏÏÏÏÏÏÏÏÏÏÏÏÏÏÏÏÏÏÏ 310 80,000
Vacation ownership resorts ÏÏÏÏÏÏÏÏÏÏÏÏÏÏÏÏÏÏÏÏÏÏÏÏÏÏÏÏÏÏÏÏÏÏÏÏÏÏÏÏÏÏÏÏÏÏÏÏÏ 19 5,000
Total properties ÏÏÏÏÏÏÏÏÏÏÏÏÏÏÏÏÏÏÏÏÏÏÏÏÏÏÏÏÏÏÏÏÏÏÏÏÏÏÏÏÏÏÏÏÏÏÏÏÏÏÏÏÏÏÏÏÏÏ 752 236,000
(a) Includes wholly owned, majority owned and leased hotels.
Number of
Properties Rooms
North America ÏÏÏÏÏÏÏÏÏÏÏÏÏÏÏÏÏÏÏÏÏÏÏÏÏÏÏÏÏÏÏÏÏÏÏÏÏÏÏÏÏÏÏÏÏÏÏÏÏÏÏÏÏÏÏÏÏÏÏ 437 151,000
Europe, Africa and the Middle East ÏÏÏÏÏÏÏÏÏÏÏÏÏÏÏÏÏÏÏÏÏÏÏÏÏÏÏÏÏÏÏÏÏÏÏÏÏÏÏÏÏ 175 43,000
Latin America ÏÏÏÏÏÏÏÏÏÏÏÏÏÏÏÏÏÏÏÏÏÏÏÏÏÏÏÏÏÏÏÏÏÏÏÏÏÏÏÏÏÏÏÏÏÏÏÏÏÏÏÏÏÏÏÏÏÏÏ 46 10,000
Asia PaciÑcÏÏÏÏÏÏÏÏÏÏÏÏÏÏÏÏÏÏÏÏÏÏÏÏÏÏÏÏÏÏÏÏÏÏÏÏÏÏÏÏÏÏÏÏÏÏÏÏÏÏÏÏÏÏÏÏÏÏÏÏÏÏ 94 32,000
Total ÏÏÏÏÏÏÏÏÏÏÏÏÏÏÏÏÏÏÏÏÏÏÏÏÏÏÏÏÏÏÏÏÏÏÏÏÏÏÏÏÏÏÏÏÏÏÏÏÏÏÏÏÏÏÏÏÏÏÏÏÏÏÏÏÏÏÏ 752 236,000
Business Segment and Geographical Information
Incorporated by reference in Note 21. Business Segment and Geographical Information, in the notes to
Ñnancial statements set forth in Part II, Item 8. Financial Statements and Supplementary Data.
Business Strategy
Our primary business objective is to maximize earnings and cash Öow by increasing the proÑtability of our
existing portfolio; selectively acquiring interests in additional assets; increasing the number of our hotel
management contracts and franchise agreements; acquiring and developing vacation ownership resorts and
selling VOIs; and maximizing the value of our owned real estate properties, including selectively disposing of
non-core hotels (including hotels where the return on invested capital is not adequate) and ""trophy'' assets
that may be sold at signiÑcant premiums. We plan to meet these objectives by leveraging our global assets,
broad customer base and other resources and by taking advantage of our scale to reduce costs. The uncertainty
relating to political and economic environments around the world and their consequent impact on travel in
their respective regions and the rest of the world, make Ñnancial planning and implementation of our strategy
more challenging.
12