Starwood 2004 Annual Report Download - page 81
Download and view the complete annual report
Please find page 81 of the 2004 Starwood annual report below. You can navigate through the pages in the report by either clicking on the pages listed below, or by using the keyword search tool below to find specific information within the annual report.-
 1
1 -
2
-
3
-
4
-
5
-
6
-
7
-
8
-
9
-
10
-
11
-
12
-
13
-
14
-
15
-
16
-
17
-
18
-
19
-
20
-
21
-
22
-
23
-
24
-
25
-
26
-
27
-
28
-
29
-
30
-
31
-
32
-
33
-
34
-
35
-
36
-
37
-
38
-
39
-
40
-
41
-
42
-
43
-
44
-
45
-
46
-
47
-
48
-
49
-
50
-
51
-
52
-
53
-
54
-
55
-
56
-
57
-
58
-
59
-
60
-
61
-
62
-
63
-
64
-
65
-
66
-
67
-
68
-
69
-
70
-
 71
71 -
 72
72 -
 73
73 -
 74
74 -
 75
75 -
 76
76 -
 77
77 -
 78
78 -
 79
79 -
 80
80 -
 81
81 -
 82
82 -
 83
83 -
 84
84 -
 85
85 -
 86
86 -
 87
87 -
 88
88 -
 89
89 -
 90
90 -
 91
91 -
92
-
93
-
94
-
95
-
96
-
97
-
98
-
99
-
100
-
101
-
102
-
103
-
104
-
105
-
106
-
107
-
108
-
109
-
110
-
111
-
112
-
113
-
114
-
115
-
116
-
117
-
118
-
119
-
120
-
121
-
122
-
123
-
124
-
125
-
126
-
127
-
128
-
129
-
130
-
131
-
132
-
133
-
134
-
135
-
136
-
137
-
138
-
139
 |
 |

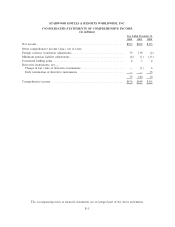
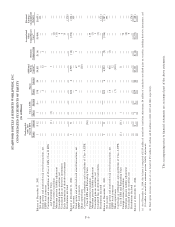
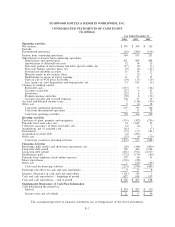
STARWOOD HOTELS & RESORTS WORLDWIDE, INC.
AND STARWOOD HOTELS & RESORTS
NOTES TO FINANCIAL STATEMENTS Ì (Continued)
The Trust has elected to be treated as a REIT under the provisions of the Code. As a result, the Trust is
not subject to federal income tax on its taxable income at corporate rates provided it distributes annually all of
its taxable income to its shareholders and complies with certain other requirements.
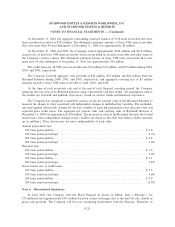
Earnings Per Share. The following represents a reconciliation of basic earnings per Share to diluted
earnings per Share for income from continuing operations (in millions, except per Share data):
Year Ended December 31,
2004 2003 2002
Earnings Shares Per Share Earnings Shares Per Share Earnings Shares Per Share
Basic earnings from
continuing operations ÏÏÏÏ $369 207 $1.78 $105 203 $0.52 $251 201 $1.24
EÅect of dilutive securities:
Employee options and
restricted stock awards Ì 8 Ì 4 Ì 4
Diluted earnings from
continuing operations ÏÏÏÏ $369 215 $1.72 $105 207 $0.51 $251 205 $1.22
Included in the Basic Share numbers for the years ended December 31, 2004, 2003 and 2002 are
approximately 1 million, 1 million and 2 million shares, respectively, of Class A Exchangeable Preferred
Shares (""Class A EPS'') and Class B Exchangeable Preferred Shares (""Class B EPS'').
As of December 31, 2004 and 2003, 7 million shares and 13 million shares, respectively, issuable under
convertible debt were excluded from the calculation of diluted earnings per Share numbers as the trigger
events for conversion had not occurred. As the terms of the contingently convertible debt instrument allow for
the Company to redeem such instruments in cash and the Company has a history of settling convertible debt
instruments in cash, the Company, in accordance with SFAS No. 128, ""Earnings Per Share,'' has utilized the
if-converted method if certain trigger events are met.
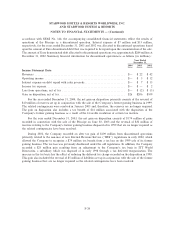
Stock-Based Compensation. The Company has four stock-based employee long-term incentive plans,
which are described in Note 17. Stock Incentive Plans. The Company accounts for those plans under the
recognition and measurement principles of Accounting Principles Board (""APB'') Opinion No. 25, ""Account-
ing for Stock Issued to Employees,'' and related interpretations. In general no stock-based employee
compensation cost is reÖected in net income as all options granted to employees under these plans have an
exercise price equal to the fair value of the underlying common stock on the date of grant. The following table
illustrates the eÅect on net income and earnings per Share if the Company had applied the fair value
F-15