Starwood 2004 Annual Report Download - page 32
Download and view the complete annual report
Please find page 32 of the 2004 Starwood annual report below. You can navigate through the pages in the report by either clicking on the pages listed below, or by using the keyword search tool below to find specific information within the annual report.-
 1
1 -
2
-
3
-
4
-
5
-
6
-
7
-
8
-
9
-
10
-
11
-
12
-
13
-
14
-
15
-
16
-
17
-
18
-
19
-
20
-
21
-
 22
22 -
 23
23 -
 24
24 -
 25
25 -
 26
26 -
 27
27 -
 28
28 -
 29
29 -
 30
30 -
 31
31 -
 32
32 -
 33
33 -
 34
34 -
 35
35 -
 36
36 -
 37
37 -
 38
38 -
 39
39 -
 40
40 -
 41
41 -
 42
42 -
43
-
44
-
45
-
46
-
47
-
48
-
49
-
50
-
51
-
52
-
53
-
54
-
55
-
56
-
57
-
58
-
59
-
60
-
61
-
62
-
63
-
64
-
65
-
66
-
67
-
68
-
69
-
70
-
71
-
72
-
73
-
74
-
75
-
76
-
77
-
78
-
79
-
80
-
81
-
82
-
83
-
84
-
85
-
86
-
87
-
88
-
89
-
90
-
91
-
92
-
93
-
94
-
95
-
96
-
97
-
98
-
99
-
100
-
101
-
102
-
103
-
104
-
105
-
106
-
107
-
108
-
109
-
110
-
111
-
112
-
113
-
114
-
115
-
116
-
117
-
118
-
119
-
120
-
121
-
122
-
123
-
124
-
125
-
126
-
127
-
128
-
129
-
130
-
131
-
132
-
133
-
134
-
135
-
136
-
137
-
138
-
139
 |
 |

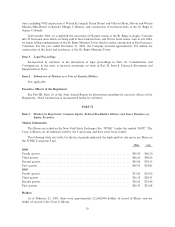
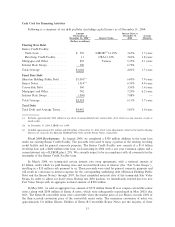
The following represents the geographical breakdown of our owned, leased and consolidated joint venture
revenues in North America by metropolitan area for the years ended December 31, 2004 and 2003:
Top Ten Metropolitan Areas as a % of Owned North America Revenues for
the Year Ended December 31, 2004 with Comparable Data for 2003
2004 2003
Metropolitan Area Revenues Revenues
New York, NY ÏÏÏÏÏÏÏÏÏÏÏÏÏÏÏÏÏÏÏÏÏÏÏÏÏÏÏÏÏÏÏÏÏÏÏÏÏÏÏÏÏÏÏÏÏÏÏÏÏÏÏÏÏÏÏÏÏÏÏÏ 19.2% 17.1%
Boston, MA ÏÏÏÏÏÏÏÏÏÏÏÏÏÏÏÏÏÏÏÏÏÏÏÏÏÏÏÏÏÏÏÏÏÏÏÏÏÏÏÏÏÏÏÏÏÏÏÏÏÏÏÏÏÏÏÏÏÏÏÏÏÏÏ 9.4% 9.2%
San Diego, CA ÏÏÏÏÏÏÏÏÏÏÏÏÏÏÏÏÏÏÏÏÏÏÏÏÏÏÏÏÏÏÏÏÏÏÏÏÏÏÏÏÏÏÏÏÏÏÏÏÏÏÏÏÏÏÏÏÏÏÏÏ 5.2% 5.8%
Phoenix, AZ ÏÏÏÏÏÏÏÏÏÏÏÏÏÏÏÏÏÏÏÏÏÏÏÏÏÏÏÏÏÏÏÏÏÏÏÏÏÏÏÏÏÏÏÏÏÏÏÏÏÏÏÏÏÏÏÏÏÏÏÏÏÏ 5.0% 4.9%
Los Angeles-Long Beach, CAÏÏÏÏÏÏÏÏÏÏÏÏÏÏÏÏÏÏÏÏÏÏÏÏÏÏÏÏÏÏÏÏÏÏÏÏÏÏÏÏÏÏÏÏÏÏÏÏ 4.8% 4.6%
Atlanta, GAÏÏÏÏÏÏÏÏÏÏÏÏÏÏÏÏÏÏÏÏÏÏÏÏÏÏÏÏÏÏÏÏÏÏÏÏÏÏÏÏÏÏÏÏÏÏÏÏÏÏÏÏÏÏÏÏÏÏÏÏÏÏÏ 4.4% 4.7%
Toronto, Canada ÏÏÏÏÏÏÏÏÏÏÏÏÏÏÏÏÏÏÏÏÏÏÏÏÏÏÏÏÏÏÏÏÏÏÏÏÏÏÏÏÏÏÏÏÏÏÏÏÏÏÏÏÏÏÏÏÏÏÏ 3.9% 3.3%
Seattle, WAÏÏÏÏÏÏÏÏÏÏÏÏÏÏÏÏÏÏÏÏÏÏÏÏÏÏÏÏÏÏÏÏÏÏÏÏÏÏÏÏÏÏÏÏÏÏÏÏÏÏÏÏÏÏÏÏÏÏÏÏÏÏÏ 3.8% 3.9%
Maui, HI ÏÏÏÏÏÏÏÏÏÏÏÏÏÏÏÏÏÏÏÏÏÏÏÏÏÏÏÏÏÏÏÏÏÏÏÏÏÏÏÏÏÏÏÏÏÏÏÏÏÏÏÏÏÏÏÏÏÏÏÏÏÏÏÏÏ 3.5% 3.1%
Houston, TX ÏÏÏÏÏÏÏÏÏÏÏÏÏÏÏÏÏÏÏÏÏÏÏÏÏÏÏÏÏÏÏÏÏÏÏÏÏÏÏÏÏÏÏÏÏÏÏÏÏÏÏÏÏÏÏÏÏÏÏÏÏÏ 2.8% 2.7%
All Other ÏÏÏÏÏÏÏÏÏÏÏÏÏÏÏÏÏÏÏÏÏÏÏÏÏÏÏÏÏÏÏÏÏÏÏÏÏÏÏÏÏÏÏÏÏÏÏÏÏÏÏÏÏÏÏÏÏÏÏÏÏÏÏÏÏ 38.0% 40.7%
Total ÏÏÏÏÏÏÏÏÏÏÏÏÏÏÏÏÏÏÏÏÏÏÏÏÏÏÏÏÏÏÏÏÏÏÏÏÏÏÏÏÏÏÏÏÏÏÏÏÏÏÏÏÏÏÏÏÏÏÏÏÏÏÏÏÏÏÏÏÏ 100% 100%
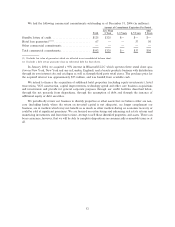
A leading indicator for the performance of our owned, leased and consolidated joint venture hotels is
REVPAR, which we consider to be a meaningful indicator of our performance, as it measures the period-over-
period growth in rooms revenue for comparable properties. This is particularly the case in the United States
where there is no impact on this measure from foreign exchange rates.
Year Ended December 31, 2004 Compared with Year Ended December 31, 2003
Continuing Operations
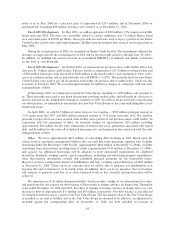
Revenues. Total revenues, including other revenues from managed and franchised properties, were
$5.368 billion, an increase of $738 million when compared to 2003 levels. Revenues reÖect a 7.8% increase in
revenues from our owned, leased and consolidated joint venture hotels to $3.326 billion for the year ended
December 31, 2004 when compared to $3.085 billion in the corresponding period of 2003, an increase of
$164 million in management fees, franchise fees and other income to $419 million for the year ended
December 31, 2004 when compared to $255 million in the corresponding period of 2003, an increase of
$201 million in vacation ownership and residential revenues to $640 million for the year ended December 31,
2004 when compared to $439 million in the corresponding period of 2003 and an increase of $132 million in
other revenues from managed and franchised properties to $983 million for the year ended December 31, 2004
when compared to $851 million in the corresponding period of 2003.
The increase in revenues from owned, leased and consolidated joint venture hotels is due in large part to
the continued economic recovery, particularly its eÅect on the hospitality industry. The war in Iraq, the SARS
epidemic and the weakened worldwide economic environment in 2003 negatively impacted the results for a
substantial part of the year ended December 31, 2003. Results in 2004 were also favorably impacted by the
addition of the Sheraton Kauai in Hawaii which we acquired in March 2004. These improved results in 2004
were oÅset, in part, by the absence in 2004 of the revenues generated by 16 non-strategic domestic hotels and
four hotels in Costa Smeralda, Italy, which were for the most part, sold in the Ñrst half of 2003. Revenues
from these hotels in 2003 were $110 million. Revenues at our hotels owned during both periods (""Same-Store
Owned Hotels'') (138 hotels for the year ended December 31, 2004 and 2003, excluding 26 hotels sold or
closed or without comparable results in 2004 and 2003) increased 11.4%, or $333 million, to $3.266 billion for
the year ended December 31, 2004 when compared to $2.933 billion in the same period of 2003 due primarily
to an increase in REVPAR. REVPAR at our Same-Store Owned Hotels increased 13.0% to $110.81 for the
year ended December 31, 2004 when compared to the corresponding 2003 period. The increase in REVPAR
24