Starwood 2004 Annual Report Download - page 33
Download and view the complete annual report
Please find page 33 of the 2004 Starwood annual report below. You can navigate through the pages in the report by either clicking on the pages listed below, or by using the keyword search tool below to find specific information within the annual report.-
 1
1 -
2
-
3
-
4
-
5
-
6
-
7
-
8
-
9
-
10
-
11
-
12
-
13
-
14
-
15
-
16
-
17
-
18
-
19
-
20
-
21
-
22
-
 23
23 -
 24
24 -
 25
25 -
 26
26 -
 27
27 -
 28
28 -
 29
29 -
 30
30 -
 31
31 -
 32
32 -
 33
33 -
 34
34 -
 35
35 -
 36
36 -
 37
37 -
 38
38 -
 39
39 -
 40
40 -
 41
41 -
 42
42 -
 43
43 -
44
-
45
-
46
-
47
-
48
-
49
-
50
-
51
-
52
-
53
-
54
-
55
-
56
-
57
-
58
-
59
-
60
-
61
-
62
-
63
-
64
-
65
-
66
-
67
-
68
-
69
-
70
-
71
-
72
-
73
-
74
-
75
-
76
-
77
-
78
-
79
-
80
-
81
-
82
-
83
-
84
-
85
-
86
-
87
-
88
-
89
-
90
-
91
-
92
-
93
-
94
-
95
-
96
-
97
-
98
-
99
-
100
-
101
-
102
-
103
-
104
-
105
-
106
-
107
-
108
-
109
-
110
-
111
-
112
-
113
-
114
-
115
-
116
-
117
-
118
-
119
-
120
-
121
-
122
-
123
-
124
-
125
-
126
-
127
-
128
-
129
-
130
-
131
-
132
-
133
-
134
-
135
-
136
-
137
-
138
-
139
 |
 |
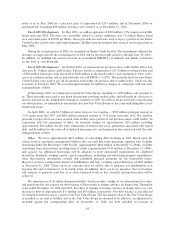
was attributed to increases in occupancy rates to 68.5% in the year ended December 31, 2004 when compared
to 64.7% in the same period in 2003, and a 6.8% increase in ADR at these Same-Store Owned Hotels to
$161.74 for the year ended December 31, 2004 compared to $151.49 for the corresponding 2003 period.
REVPAR at Same-Store Owned Hotels in North America increased 12.1% for the year ended December 31,
2004 when compared to the same period of 2003 due to increased transient and group travel business for the
period. REVPAR growth at these hotels, and thereby revenues, was strongest in major metropolitan cities
such as New York, Boston, Toronto and Los Angeles where we have a large concentration of owned hotels.
REVPAR at our international Same-Store Owned Hotels, increased by 15.6% for the year ended Decem-
ber 31, 2004 when compared to the same period of 2003, with Europe, where we have our biggest
concentration of international owned hotels, increasing 13.2%. REVPAR for Same-Store Owned Hotels
internationally increased 6.7% for the year ended December 31, 2004 excluding the favorable eÅects of foreign
currency translation. REVPAR for Same-Store Owned Hotels in Europe increased 3.1% excluding the
favorable eÅect of foreign currency translation.
The increase in vacation ownership and residential sales and services is primarily due to the increase in
the sales of VOIs of 47.1% to $531 million in 2004 compared to $361 million in 2003. These increases
represent increased sales volume as well as the revenue recognition from progressing and completed projects
accounted for under the percentage of completion accounting methodology as required by generally accepted
accounting principles primarily at the Westin Ka'anapali Ocean Resort Villas in Maui, Hawaii, The St. Regis
in Aspen, Colorado, the Westin Kierland Resort and Spa in Scottsdale, Arizona, the Sheraton Vistana
Villages in Orlando, Florida, and the Westin Mission Hills Resort in Rancho Mirage, California. Contract
sales of VOI inventory, which represents vacation ownership revenues before adjustments for percentage of
completion accounting and rescissions and excluding fractional sales at the St. Regis Aspen and residential
sales at the St. Regis Museum Tower in San Francisco, California described below, increased 28.4% in the
year ended December 31, 2004 when compared to the same period in 2003. The increase in vacation
ownership and residential sales in 2004, when compared to 2003, was also due to sales of fractional units at the
St. Regis in Aspen, Colorado and residential units at the St. Regis Museum Tower in San Francisco,
California, both of which were new projects in 2004. In December 2004, we completed the conversion of 98
guest rooms at the St. Regis in Aspen into 25 fractional units, which are being sold in four week intervals, and
20 new hotel rooms. In 2004, we recognized approximately $51 million of revenues from this project. We also
began selling condominiums at the St. Regis Museum Tower in San Francisco in late 2004 and recognized
approximately $15 million of revenues from this project in 2004. The St. Regis Museum Tower is under
construction and is expected to open in the summer of 2005 with 260 hotel rooms and 102 condominium units.
The increase in management fees, franchise fees and other income of $164 million was primarily due to
the inclusion of approximately $49 million of revenues from the Bliss spas and product sales, which were
acquired at the beginning of 2004, and approximately $46 million of income (including the impact of foreign
exchange rates) earned on the Le Meridien debt participation acquired by us in late December 2003.
Additionally, management and franchise fees increased approximately $53 million to $303 million for the year
ended December 31, 2004, when compared to $250 million in the same period of 2003, due to strong top line
growth resulting from the economic recovery discussed earlier.
Other revenues and expenses from managed and franchised properties increased to $983 million from
$851 million for the year ended December 31, 2004 and 2003, respectively. These revenues represent
reimbursements of costs incurred on behalf of managed hotel properties and franchisees and relate primarily to
payroll costs at managed properties where we are the employer. Since the reimbursements are made based
upon the costs incurred with no added margin, these revenues and corresponding expenses have no eÅect on
our operating income and our net income.
Operating Income. Our total operating income was $653 million in the year ended December 31, 2004
compared to $427 million in 2003. Excluding depreciation and amortization of $431 million and $429 million
for the years ended December 31, 2004 and 2003, respectively, operating income increased 26.6% or
$228 million to $1.084 billion for the year ended December 31, 2004 when compared to $856 million in the
same period in 2003, primarily due to the improved owned hotel performance and vacation ownership sales
25