Starwood 2004 Annual Report Download - page 101
Download and view the complete annual report
Please find page 101 of the 2004 Starwood annual report below. You can navigate through the pages in the report by either clicking on the pages listed below, or by using the keyword search tool below to find specific information within the annual report.-
 1
1 -
2
-
3
-
4
-
5
-
6
-
7
-
8
-
9
-
10
-
11
-
12
-
13
-
14
-
15
-
16
-
17
-
18
-
19
-
20
-
21
-
22
-
23
-
24
-
25
-
26
-
27
-
28
-
29
-
30
-
31
-
32
-
33
-
34
-
35
-
36
-
37
-
38
-
39
-
40
-
41
-
42
-
43
-
44
-
45
-
46
-
47
-
48
-
49
-
50
-
51
-
52
-
53
-
54
-
55
-
56
-
57
-
58
-
59
-
60
-
61
-
62
-
63
-
64
-
65
-
66
-
67
-
68
-
69
-
70
-
71
-
72
-
73
-
74
-
75
-
76
-
77
-
78
-
79
-
80
-
81
-
82
-
83
-
84
-
85
-
86
-
87
-
88
-
89
-
90
-
 91
91 -
 92
92 -
 93
93 -
 94
94 -
 95
95 -
 96
96 -
 97
97 -
 98
98 -
 99
99 -
 100
100 -
 101
101 -
 102
102 -
 103
103 -
 104
104 -
 105
105 -
 106
106 -
 107
107 -
 108
108 -
 109
109 -
 110
110 -
 111
111 -
112
-
113
-
114
-
115
-
116
-
117
-
118
-
119
-
120
-
121
-
122
-
123
-
124
-
125
-
126
-
127
-
128
-
129
-
130
-
131
-
132
-
133
-
134
-
135
-
136
-
137
-
138
-
139
 |
 |

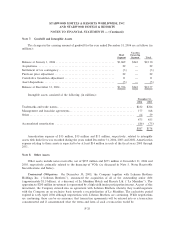
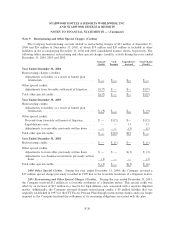
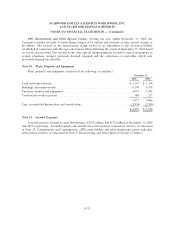
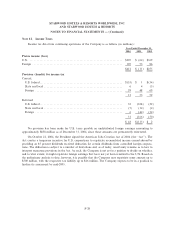
STARWOOD HOTELS & RESORTS WORLDWIDE, INC.
AND STARWOOD HOTELS & RESORTS
NOTES TO FINANCIAL STATEMENTS Ì (Continued)
beneÑt obligation. At December 31, 2004 and 2003, the accumulated beneÑt obligation for the foreign pension
plans was $129 million and $112 million, respectively. At December 31, 2004 and 2003, the projected beneÑt
obligation and accumulated beneÑt obligation exceeded the fair value of plan assets for all of the Company's
domestic and foreign pension plans, and the accumulated postretirement beneÑt obligation exceeded plan
assets of the postretirement beneÑt plan.
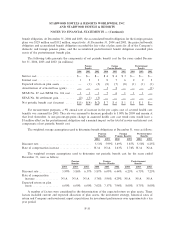
The following table presents the components of net periodic beneÑt cost for the years ended Decem-
ber 31, 2004, 2003 and 2002 (in millions):
Pension Foreign Postretirement
BeneÑts Pension BeneÑts BeneÑts
2004 2003 2002 2004 2003 2002 2004 2003 2002
Service cost ÏÏÏÏÏÏÏÏÏÏÏÏÏÏÏÏÏÏÏÏÏÏÏÏÏÏ $Ì $Ì $Ì $ 4 $ 4 $ 3 $Ì $Ì $Ì
Interest cost ÏÏÏÏÏÏÏÏÏÏÏÏÏÏÏÏÏÏÏÏÏÏÏÏÏ 123876222
Expected return on plan assets ÏÏÏÏÏÏÏÏÏÏ Ì (1) (2) (8) (7) (8) (1) (1) (1)
Amortization of actuarial loss (gain)ÏÏÏÏÏ Ì Ì Ì 3 2ÌÌÌ(1)
SFAS No. 87 cost/SFAS No. 106 cost ÏÏ 11176111Ì
SFAS No. 88 settlement gainÏÏÏÏÏÏÏÏÏÏÏ (2) (5) (3) ÌÌÌÌÌÌ
Net periodic beneÑt cost (income) ÏÏÏÏÏÏ $(1) $(4) $(2) $ 7 $ 6 $ 1 $ 1 $ 1 $Ì
For measurement purposes, a 9% annual rate of increase in the per capita cost of covered health care
beneÑts was assumed for 2005. The rate was assumed to decrease gradually to 5.00% for 2009 and remain at
that level thereafter. A one-percentage-point change in assumed health care cost trend rates would have a
$1 million eÅect on the postretirement obligation and a nominal impact on the total of service and interest cost
components of net periodic beneÑt cost.
The weighted average assumptions used to determine beneÑt obligations at December 31, were as follows:
Pension Foreign Postretirement
BeneÑts Pension BeneÑts BeneÑts
2004 2003 2004 2003 2004 2003
Discount rateÏÏÏÏÏÏÏÏÏÏÏÏÏÏÏÏÏÏÏÏÏÏÏÏÏÏÏÏÏÏÏÏÏÏÏÏÏ 5.51% 5.99% 5.49% 5.87% 5.50% 6.25%
Rate of compensation increase ÏÏÏÏÏÏÏÏÏÏÏÏÏÏÏÏÏÏÏÏÏÏ N/A N/A 3.63% 3.74% N/A N/A
The weighted average assumptions used to determine net periodic beneÑt cost for the years ended
December 31, were as follows:
Pension Foreign Postretirement
BeneÑts Pension BeneÑts BeneÑts
2004 2003 2002 2004 2003 2002 2004 2003 2002
Discount rateÏÏÏÏÏÏÏÏÏÏÏÏÏÏ 5.99% 5.86% 6.37% 5.87% 6.09% 6.44% 6.25% 6.75% 7.25%
Rate of compensation
increase ÏÏÏÏÏÏÏÏÏÏÏÏÏÏÏÏ N/A N/A N/A 3.74% 3.96% 4.29% N/A N/A N/A
Expected return on plan
assets ÏÏÏÏÏÏÏÏÏÏÏÏÏÏÏÏÏÏ 6.00% 6.00% 6.00% 7.02% 7.37% 7.94% 8.00% 8.75% 8.00%
A number of factors were considered in the determination of the expected return on plan assets. These
factors included current and expected allocation of plan assets, the investment strategy, historical rates of
return and Company and investment expert expectations for investment performance over approximately a ten
year period.
F-35