Starwood 2004 Annual Report Download - page 35
Download and view the complete annual report
Please find page 35 of the 2004 Starwood annual report below. You can navigate through the pages in the report by either clicking on the pages listed below, or by using the keyword search tool below to find specific information within the annual report.-
 1
1 -
2
-
3
-
4
-
5
-
6
-
7
-
8
-
9
-
10
-
11
-
12
-
13
-
14
-
15
-
16
-
17
-
18
-
19
-
20
-
21
-
22
-
23
-
24
-
 25
25 -
 26
26 -
 27
27 -
 28
28 -
 29
29 -
 30
30 -
 31
31 -
 32
32 -
 33
33 -
 34
34 -
 35
35 -
 36
36 -
 37
37 -
 38
38 -
 39
39 -
 40
40 -
 41
41 -
 42
42 -
 43
43 -
 44
44 -
 45
45 -
46
-
47
-
48
-
49
-
50
-
51
-
52
-
53
-
54
-
55
-
56
-
57
-
58
-
59
-
60
-
61
-
62
-
63
-
64
-
65
-
66
-
67
-
68
-
69
-
70
-
71
-
72
-
73
-
74
-
75
-
76
-
77
-
78
-
79
-
80
-
81
-
82
-
83
-
84
-
85
-
86
-
87
-
88
-
89
-
90
-
91
-
92
-
93
-
94
-
95
-
96
-
97
-
98
-
99
-
100
-
101
-
102
-
103
-
104
-
105
-
106
-
107
-
108
-
109
-
110
-
111
-
112
-
113
-
114
-
115
-
116
-
117
-
118
-
119
-
120
-
121
-
122
-
123
-
124
-
125
-
126
-
127
-
128
-
129
-
130
-
131
-
132
-
133
-
134
-
135
-
136
-
137
-
138
-
139
 |
 |
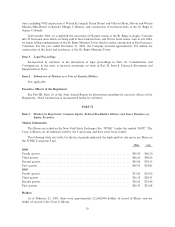
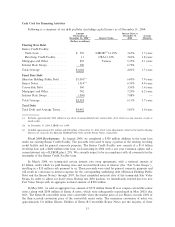
For the year ended December 31, 2003, loss from discontinued operations represents the results of the
Principe di Savoia Hotel in Milan, Italy (""Principe'') net of $7 million of allocated interest expense. We sold
the Principe in June 2003, with no continuing involvement. The net gain on dispositions for the year ended
December 31, 2003 consists of $174 million of gains recorded in connection with the sale of the Principe on
June 30, 2003 and the reversal of a $32 million accrual relating to our former gaming business disposed of in
1999 and 2000. We believe that these accruals are no longer required as the related contingencies have been
resolved.
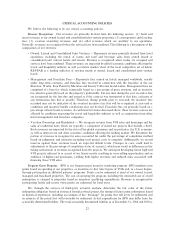
Income Tax Expense. The eÅective income tax rate for continuing operations for the year ended
December 31, 2004 was approximately 10.5%. Our eÅective income tax rate is determined by the level and
composition of pre-tax income subject to varying foreign, state and local taxes and other items. The eÅective
tax rate for the year ended December 31, 2004 beneÑted from approximately $28 million primarily related to
the reversal of tax reserves as a result of the resolution of certain tax matters during the year. For the year
ended December 31, 2003 we had a tax beneÑt of $113 million on a pre-tax loss of $11 million, primarily due
to the tax exempt Trust income and the favorable settlement of various tax matters.
Year Ended December 31, 2003 Compared with Year Ended December 31, 2002
Continuing Operations
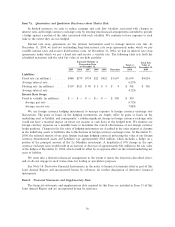
Revenues. Total revenues, including other revenues from managed and franchised properties, were
$4.630 billion, remaining virtually Öat compared to 2002 levels. Revenues reÖect a 3.3% decrease in revenues
from our owned, leased and consolidated joint venture hotels to $3.085 billion for the year ended Decem-
ber 31, 2003 when compared to $3.190 billion in the corresponding period of 2002, a decrease of $10 million in
management fees, franchise fees and other income to $255 million for the year ended December 31, 2003
when compared to $265 million in the corresponding period of 2002, an increase of $86 million in vacation
ownership and residential revenues to $439 million for the year ended December 31, 2003 when compared to
$353 million in the corresponding period of 2002 and an increase of $71 million in other revenues from
managed and franchised properties to $851 million for the year ended December 31, 2003 when compared to
$780 million in the corresponding period of 2002.
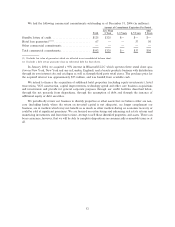
The decrease in revenues from owned, leased and consolidated joint venture hotels is due primarily to the
absence of revenues generated by 16 non-strategic domestic hotels and four hotels in Costa Smeralda, Italy,
which were mostly sold in the Ñrst half of 2003, and oÅset by increased revenues from our Same-Store Owned
Hotels (140 hotels for 2003 and 2002, excluding 25 hotels sold or closed during these periods). Revenues from
the 20 sold hotels during 2003 were $110 million, a decrease of $140 million as compared to $250 million in
the same period of 2002. Revenues from our Same-Store Owned Hotels increased 2.0% to $2.967 billion for
the year ended December 31, 2003 when compared to $2.909 billion in the same period of 2002 due primarily
to an increase in REVPAR. REVPAR at our Same-Store Owned Hotels increased 1.3% to $98.34 for the year
ended December 31, 2003 when compared to the corresponding 2002 period. The increase in REVPAR at
these Same-Store Owned Hotels was attributed to an increase in occupancy to 64.6% in the year ended
December 31, 2003 when compared to 64.0% in the same period of 2002 and a slight increase in ADR of 0.3%
to $152.12 for the year ended December 31, 2003 compared to $151.69 for the corresponding 2002 period.
REVPAR at Same-Store Owned Hotels in North America decreased 0.2% for the year ended December 31,
2003 when compared to the same period of 2002. The slight decrease in REVPAR and revenues from owned,
leased and consolidated joint venture hotels in North America was primarily due to the decline in business
transient demand as a result of the weakened global economies. REVPAR at our international Same-Store
Owned Hotels increased by 5.8% for the year ended December 31, 2003 when compared to the same period of
2002, primarily due to the favorable eÅect of foreign currency translation. Including the impact of foreign
currency, REVPAR for Same-Store Owned Hotels in Europe increased 6.2%, in Latin America decreased
5.5% and in Asia PaciÑc increased 31.7% when compared to 2002. Excluding the favorable eÅect of foreign
exchange, REVPAR at our Same-Store Owned Hotels internationally decreased 6.5% for the year ended 2003
when compared to 2002 due to the weakened global economies and adverse political and economic conditions.
27