Starwood 2004 Annual Report Download - page 128
Download and view the complete annual report
Please find page 128 of the 2004 Starwood annual report below. You can navigate through the pages in the report by either clicking on the pages listed below, or by using the keyword search tool below to find specific information within the annual report.-
 1
1 -
2
-
3
-
4
-
5
-
6
-
7
-
8
-
9
-
10
-
11
-
12
-
13
-
14
-
15
-
16
-
17
-
18
-
19
-
20
-
21
-
22
-
23
-
24
-
25
-
26
-
27
-
28
-
29
-
30
-
31
-
32
-
33
-
34
-
35
-
36
-
37
-
38
-
39
-
40
-
41
-
42
-
43
-
44
-
45
-
46
-
47
-
48
-
49
-
50
-
51
-
52
-
53
-
54
-
55
-
56
-
57
-
58
-
59
-
60
-
61
-
62
-
63
-
64
-
65
-
66
-
67
-
68
-
69
-
70
-
71
-
72
-
73
-
74
-
75
-
76
-
77
-
78
-
79
-
80
-
81
-
82
-
83
-
84
-
85
-
86
-
87
-
88
-
89
-
90
-
91
-
92
-
93
-
94
-
95
-
96
-
97
-
98
-
99
-
100
-
101
-
102
-
103
-
104
-
105
-
106
-
107
-
108
-
109
-
110
-
111
-
112
-
113
-
114
-
115
-
116
-
117
-
 118
118 -
 119
119 -
 120
120 -
 121
121 -
 122
122 -
 123
123 -
 124
124 -
 125
125 -
 126
126 -
 127
127 -
 128
128 -
 129
129 -
 130
130 -
 131
131 -
 132
132 -
 133
133 -
 134
134 -
 135
135 -
 136
136 -
 137
137 -
 138
138 -
139
 |
 |

STARWOOD HOTELS & RESORTS WORLDWIDE, INC.
AND STARWOOD HOTELS & RESORTS
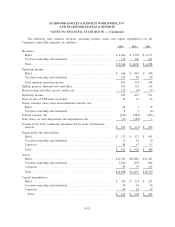
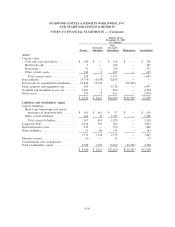
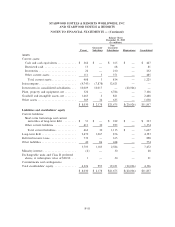
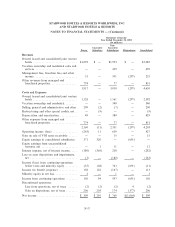
NOTES TO FINANCIAL STATEMENTS Ì (Continued)
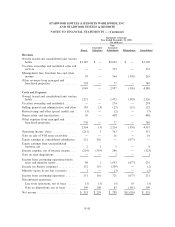
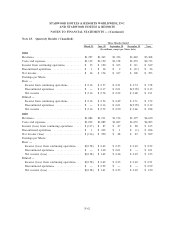
Note 23. Quarterly Results (Unaudited)
Three Months Ended
March 31 June 30 September 30 December 31 Year
(In millions, except per Share data)
2004
RevenuesÏÏÏÏÏÏÏÏÏÏÏÏÏÏÏÏÏÏÏÏÏÏÏÏÏÏÏÏÏÏÏÏÏ $1,227 $1,363 $1,336 $1,442 $5,368
Costs and expenses ÏÏÏÏÏÏÏÏÏÏÏÏÏÏÏÏÏÏÏÏÏÏÏÏ $1,132 $1,190 $1,138 $1,255 $4,715
Income from continuing operations ÏÏÏÏÏÏÏÏÏÏÏ $ 33 $ 120 $ 105 $ 111 $ 369
Discontinued operations ÏÏÏÏÏÏÏÏÏÏÏÏÏÏÏÏÏÏÏÏ $ 1 $ 34 $ 2 $ (11) $ 26
Net incomeÏÏÏÏÏÏÏÏÏÏÏÏÏÏÏÏÏÏÏÏÏÏÏÏÏÏÏÏÏÏÏ $ 34 $ 154 $ 107 $ 100 $ 395
Earnings per Share:
Basic Ì
Income from continuing operations ÏÏÏÏÏÏÏÏÏ $ 0.16 $ 0.57 $ 0.51 $ 0.53 $ 1.78
Discontinued operations ÏÏÏÏÏÏÏÏÏÏÏÏÏÏÏÏÏÏ $ Ì $ 0.17 $ 0.01 $(0.05) $ 0.13
Net incomeÏÏÏÏÏÏÏÏÏÏÏÏÏÏÏÏÏÏÏÏÏÏÏÏÏÏÏÏÏ $ 0.16 $ 0.74 $ 0.52 $ 0.48 $ 1.91
Diluted Ì
Income from continuing operations ÏÏÏÏÏÏÏÏÏ $ 0.16 $ 0.56 $ 0.49 $ 0.51 $ 1.72
Discontinued operations ÏÏÏÏÏÏÏÏÏÏÏÏÏÏÏÏÏÏ $ Ì $ 0.16 $ 0.01 $(0.05) $ 0.12
Net incomeÏÏÏÏÏÏÏÏÏÏÏÏÏÏÏÏÏÏÏÏÏÏÏÏÏÏÏÏÏ $ 0.16 $ 0.72 $ 0.50 $ 0.46 $ 1.84
2003
RevenuesÏÏÏÏÏÏÏÏÏÏÏÏÏÏÏÏÏÏÏÏÏÏÏÏÏÏÏÏÏÏÏÏÏ $1,086 $1,211 $1,136 $1,197 $4,630
Costs and expenses ÏÏÏÏÏÏÏÏÏÏÏÏÏÏÏÏÏÏÏÏÏÏÏÏ $1,032 $1,089 $1,027 $1,055 $4,203
Income (loss) from continuing operations ÏÏÏÏÏ $ (117) $ 87 $ 47 $ 88 $ 105
Discontinued operations ÏÏÏÏÏÏÏÏÏÏÏÏÏÏÏÏÏÏÏÏ $ 1 $ 203 $ 1 $ (1) $ 204
Net income (loss) ÏÏÏÏÏÏÏÏÏÏÏÏÏÏÏÏÏÏÏÏÏÏÏÏÏ $ (116) $ 290 $ 48 $ 87 $ 309
Earnings per Share:
Basic Ì
Income (loss) from continuing operations ÏÏÏ $(0.58) $ 0.43 $ 0.23 $ 0.43 $ 0.52
Discontinued operations ÏÏÏÏÏÏÏÏÏÏÏÏÏÏÏÏÏÏ $ Ì $ 1.00 $ 0.01 $ Ì $ 1.01
Net income (loss) ÏÏÏÏÏÏÏÏÏÏÏÏÏÏÏÏÏÏÏÏÏÏÏ $(0.58) $ 1.43 $ 0.24 $ 0.43 $ 1.53
Diluted Ì
Income (loss) from continuing operations ÏÏÏ $(0.58) $ 0.42 $ 0.23 $ 0.42 $ 0.51
Discontinued operations ÏÏÏÏÏÏÏÏÏÏÏÏÏÏÏÏÏÏ $ Ì $ 0.99 $ Ì $ Ì $ 0.99
Net income (loss) ÏÏÏÏÏÏÏÏÏÏÏÏÏÏÏÏÏÏÏÏÏÏÏ $(0.58) $ 1.41 $ 0.23 $ 0.42 $ 1.50
F-62