Square Enix 2006 Annual Report Download - page 65
Download and view the complete annual report
Please find page 65 of the 2006 Square Enix annual report below. You can navigate through the pages in the report by either clicking on the pages listed below, or by using the keyword search tool below to find specific information within the annual report.-
 1
1 -
2
-
3
-
4
-
5
-
6
-
7
-
8
-
9
-
10
-
11
-
12
-
13
-
14
-
15
-
16
-
17
-
18
-
19
-
20
-
21
-
22
-
23
-
24
-
25
-
26
-
27
-
28
-
29
-
30
-
31
-
32
-
33
-
34
-
35
-
36
-
37
-
38
-
39
-
40
-
41
-
42
-
43
-
44
-
45
-
46
-
47
-
48
-
49
-
50
-
51
-
52
-
53
-
54
-
 55
55 -
 56
56 -
 57
57 -
 58
58 -
 59
59 -
 60
60 -
 61
61 -
 62
62 -
 63
63 -
 64
64 -
 65
65 -
 66
66 -
 67
67 -
 68
68
 |
 |

6 2 6 3
A n n u a l R e p o r t 2 0 0 6
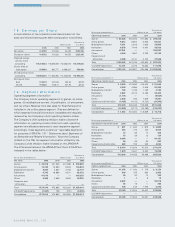
Thousands of
As of March 31 Millions of yen U.S. dollars
Assets 2006 2005 2004 2006
Games ¥067,658 ¥064,860 ¥055,104 $0,575,960
Online games 15,421 20,753 14,215 131,278
Mobilephone Content 4,057 4,725 2,583 34,536
Publication 12,349 20,448 14,225 105,119
Amusement 80,897 ——688,662
Others 6,912 6,169 5,983 58,841
Corporate and
elimination 26,055 14,740 18,523 221,803
Total ¥213,349 ¥131,695 ¥110,633 $1,816,199
U.S.GAAP adjustments 70,961 70,669 71,415 604,079
Consolidated ¥284,310 ¥202,364 ¥182,048 $2,420,278
Geographic information
The Company’s chief decision maker also regularly reviews seg-
ment information by geographic area. Since such information is
based on the JPNGAAP, the differences between the JPNGAAP
and the U.S.GAAP are indicated in the tables below:
Thousands of
For the years ended M arch 31 Millions of yen U.S. dollars
Sales from external
customers 2006 2005 2004 2006
Japan ¥107,354 ¥60,949 ¥49,354 $0,913,886
North America 14,670 11,529 12,981 124,886
Europe 414 577 148 3,522
Asia excluding Japan 2,035 810 719 17,325
Corporate and
elimination ——— —
Total ¥124,473 ¥73,865 ¥63,202 $1,059,619
U.S.GAAP adjustments (1,057) 198 (107) (9,005)
Consolidated ¥123,416 ¥74,063 ¥63,095 $1,050,614
Thousands of
For the years ended M arch 31 Millions of yen U.S. dollars
Inter segment sales 2006 2005 2004 2006
Japan ¥4,317 ¥3,437 ¥3,718 $36,746
North America 837 361 389 7,127
Europe 364 313 279 3,101
Asia excluding Japan 613 0 48
Corporate and elimination (5,524) (4,124) (4,386) (47,022)
Total ——— —
U.S.GAAP adjustments ——— —
Consolidated ——— —
Thousands of
For the years ended M arch 31 Millions of yen U.S. dollars
Total sales 2006 2005 2004 2006
Japan ¥111,671 ¥64,386 ¥53,073 $0,950,632
North America 15,507 11,890 13,371 132,013
Europe 778 890 428 6,623
Asia excluding Japan 2,041 823 717 17,373
Corporate and
elimination (5,524) (4,124) (4,387) (47,022)
Total ¥124,473 ¥73,865 ¥63,202 $1,059,619
U.S.GAAP adjustments (1,057) 198 (107) (9,005)
Consolidated ¥123,416 ¥74,063 ¥63,095 $1,050,614
Thousands of
For the years ended M arch 31 Millions of yen U.S. dollars
Operating expenses 2006 2005 2004 2006
Japan ¥099,911 ¥40,425 ¥36,880 $0,850,521
North America 12,109 9,619 10,178 103,086
Europe 729 859 336 6,203
Asia excluding Japan 1,778 646 796 15,136
Corporate and elimination (5,524) (4,123) (4,387) (47,022)
Total ¥109,003 ¥47,426 ¥43,803 $0,927,924
U.S.GAAP adjustments 13,151 2,375 10,683 111,972
Consolidated ¥122,154 ¥49,801 ¥54,486 $1,039,896
Thousands of
For the years ended M arch 31 Millions of yen U.S. dollars
Operating income 2006 2005 2004 2006
Japan ¥11,760 ¥23,961 ¥16,192 $100,111
North America 3,398 2,270 3,192 28,927
Europe 49 31 91 420
Asia excluding Japan 263 177 (77) 2,237
Corporate and elimination ——— —
Total ¥15,470 ¥26,439 ¥19,398 $131,695
U.S.GAAP adjustments (14,208) (2,177) (10,789) (120,977)
Consolidated ¥01,262 ¥24,262 ¥08,609 $010,718
Thousands of
As of March 31 Millions of yen U.S. dollars
Assets 2006 2005 2004 2006
Japan ¥196,211 ¥118,307 ¥096,547 $1,670,303
North America 12,684 10,694 12,106 107,974
Europe 1,207 1,010 772 10,279
Asia excluding Japan 3,247 1,684 1,208 27,643
Corporate and elimination ——— —
Total ¥213,349 ¥131,695 ¥110,633 $1,816,199
U.S.GAAP adjustments 70,961 70,669 71,415 604,079
Consolidated ¥284,310 ¥202,364 ¥182,048 $2,420,278
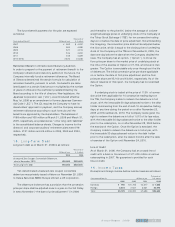
2 0 . R e la t e d P a r t y T r a n s a c t io n
No related party transaction was identified for the years ended
March 31,2006, 2005 and 2004.
2 1 . S u b s e q u e n t E v e n t
Sale of Taito’s Commercial Karaoke Business
On April 27, the Company decided to sell off Taito’s commer-
cial karaoke business to XING INC., one of the major commer-
cial karaoke operators and a subsidiary of BROTHER INDUSTRIES
LTD., in order to restructure overall business of Taito. As of
March 31, 2006, book value of assets and liabilities associated
with Business were ¥2,602 million and ¥708 million, respectively,
and net selling price was agreed upon at ¥4,683 million, subject
to adjustment after closing depending on the circumstances.
The sale was consummated on July 3, 2006.
Dividend Declared
The annual stockholders’ meeting for the year ended March 31,
2006 was held on June 24, 2006 in Tokyo. In the meeting, the
year-end cash dividend in total amount of ¥2,210 million was
proposed by the management of the Company and approved
by the stockholders.