Square Enix 2006 Annual Report Download - page 26
Download and view the complete annual report
Please find page 26 of the 2006 Square Enix annual report below. You can navigate through the pages in the report by either clicking on the pages listed below, or by using the keyword search tool below to find specific information within the annual report.-
 1
1 -
2
-
3
-
4
-
5
-
6
-
7
-
8
-
9
-
10
-
11
-
12
-
13
-
14
-
15
-
 16
16 -
 17
17 -
 18
18 -
 19
19 -
 20
20 -
 21
21 -
 22
22 -
 23
23 -
 24
24 -
 25
25 -
 26
26 -
 27
27 -
 28
28 -
 29
29 -
 30
30 -
 31
31 -
 32
32 -
 33
33 -
 34
34 -
 35
35 -
 36
36 -
37
-
38
-
39
-
40
-
41
-
42
-
43
-
44
-
45
-
46
-
47
-
48
-
49
-
50
-
51
-
52
-
53
-
54
-
55
-
56
-
57
-
58
-
59
-
60
-
61
-
62
-
63
-
64
-
65
-
66
-
67
-
68
 |
 |

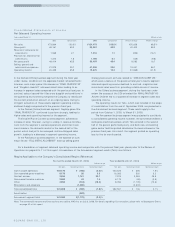
S Q U A R E E N IX C O . , L T D .
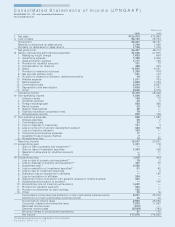
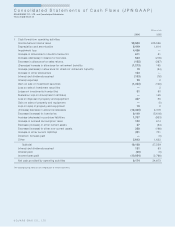
C o n s o lid a t e d S t a t e m e n t s o f In c o m e (J P N G A A P )
SQUARE ENIX CO., LTD. and Consolidated Subsidiaries
Years ended March 31
Millions of yen
2006 2005
I Net sales ¥124,473 ¥73,864
II Cost of sales 68,105 25,703
Gross profit 56,367 48,161
Reversal of allowance for sales returns 1,316 1,569
Provision for allowance for sales returns 1,186 1,316
Net gross profit 56,497 48,414
III Selling, general and administrative expenses* 141,026 21,975
1. Packaging freight charge 1,623 634
2. Advertising expense 7,458 5,346
3. Sales promotion expense 1,177 109
4. Provision for doubtful accounts 101 77
5. Compensation for directors 498 233
6. Salary 11,604 4,251
7. Provision to reserve for bonuses 1,350 418
8. Net periodic pension costs 251 107
9. Provision to reserve for directors’ retirement benefits 19 121
10. Welfare expense 1,511 753
11. Rental expense 1,949 1,033
12. Commissions paid 3,204 2,667
13. Depreciation and amortization 1,648 1,141
14. Other 8,625 5,079
Operating income 15,470 26,438
IV Non-operating income 1,046 542
1. Interest income 139 72
2. Dividends received 23 4
3. Foreign exchange gain 508 296
4. Rental income 63 30
5. Support fees received 28 —
6. Facilities installation cooperation fees 79 —
7. Miscellaneous income 202 138
V Non-operating expenses 968 1,080
1. Interest expenses 29 2
2. Commissions paid 94 —
3. Loss on disposal of inventories 151 3
4. Loss on write-off of content development account 460 983
5. Loss on inventory valuation 190 —
6. Corporate bond issuance expenses 17 —
7. Investment loss on equity method 7—
8. Miscellaneous loss 18 90
Recurring income 15,547 25,901
VI Extraordinary gain 1,361 118
1. Gain on sale of property and equipment* 2—0
2. Gain on sale of investment securities 1,353 106
3. Reversal of allowance for doubtful accounts —11
4. Other 8—
VII
Extraordinary loss 7,878 443
1. Loss on sale of property and equipment* 319 2
2. Loss on disposal of property and equipment* 4457 50
3. Impairment loss* 64,426 —
4. Loss on evaluation of investment securities* 591 80
5. Loss on sale of investment securities —2
6. Evaluation loss on shares held in affiliates —145
7. Loss on liquidation of affiliates 209 —
8. Adjustment loss in connection with advance received in mobile business 302 —
9. Accelerated amortization of goodwill —145
10. Extraordinary loss on inventory write-downs 1,652 —
11. Provision for doubtful accounts 505 —
12. Provision to allowance for store closings 153 —
13. Other 59 16
Income before income taxes and distribution of loss in partnership (tokumei-kumiai)
9,031 25,576
Distribution of loss in partnership (tokumei-kumiai)40 20
Income before income taxes 8,990 25,556
Corporate, resident and enterprise taxes 1,835 11,267
Refunded income taxes (912) —
Deferred income taxes (9,039) (760)
Minority interest in consolidated subsidiaries 31 116
Net income ¥17,076 ¥14,932
The accompanying notes are an integral part of these statements.