Square Enix 2006 Annual Report Download - page 2
Download and view the complete annual report
Please find page 2 of the 2006 Square Enix annual report below. You can navigate through the pages in the report by either clicking on the pages listed below, or by using the keyword search tool below to find specific information within the annual report.-
 1
1 -
 2
2 -
 3
3 -
 4
4 -
 5
5 -
 6
6 -
 7
7 -
 8
8 -
 9
9 -
 10
10 -
 11
11 -
 12
12 -
 13
13 -
14
-
15
-
16
-
17
-
18
-
19
-
20
-
21
-
22
-
23
-
24
-
25
-
26
-
27
-
28
-
29
-
30
-
31
-
32
-
33
-
34
-
35
-
36
-
37
-
38
-
39
-
40
-
41
-
42
-
43
-
44
-
45
-
46
-
47
-
48
-
49
-
50
-
51
-
52
-
53
-
54
-
55
-
56
-
57
-
58
-
59
-
60
-
61
-
62
-
63
-
64
-
65
-
66
-
67
-
68
 |
 |
SQUARE ENIX CO., LTD.
Contents
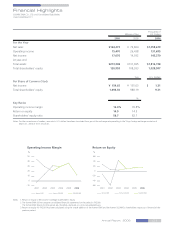
Financial Highlights 01
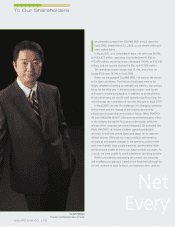
To Our Shareholders 02
Review of Operations 08
Corporate Governance 12
Directors, Auditors and Executive Officers 13
Financial Section 14
Corporate Data 65
Investor Information 66
Disclaimer Regarding Forward-Looking Statements
Statements in this annual report with respect to the current plans, estimates, strategy, and beliefs
of SQUARE ENIX CO., LTD., and consolidated subsidiaries [collectively ”SQUARE ENIX”] include both
historical facts and forward-looking statements concerning the future performance of SQUARE ENIX.
Such information is based on management’s assumptions and beliefs in light of the information
currently available and, therefore, involve risks and uncertainties. Actual results may differ materially
from those anticipated in these statements due to the influence of a number of important factors.
Such factors include but are not limited to: [1] general economic conditions in Japan and foreign
countries, in particular levels of consumer spending; [2] fluctuations in exchange rates, in particular the
exchange rate of the Japanese yen in relation to the U.S. dollar, the euro and others, which SQUARE
ENIX uses extensively in its overseas business; [3] the continuous introduction of new products, and rapid
technical innovation in the digital entertainment industry; and [4] SQUARE ENIX’s ability to
continue developing products and services accepted by consumers in the intensely competitive
market, which is heavily influenced by subjective and quickly changing consumer preferences.
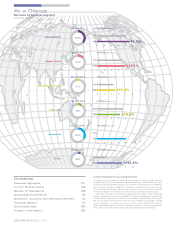
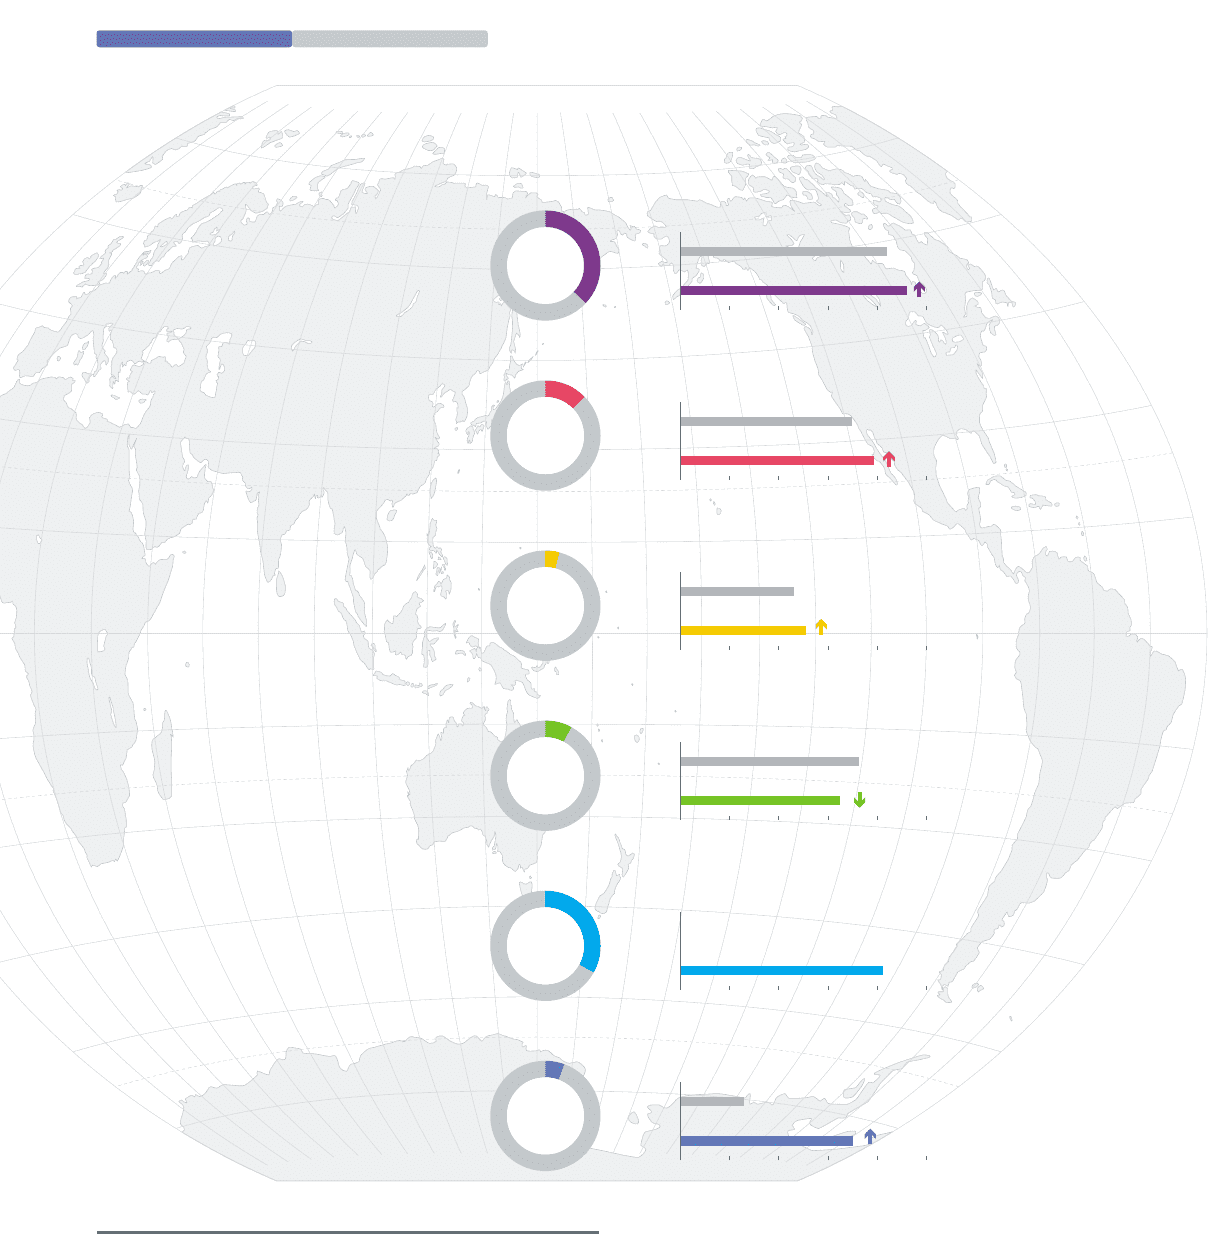
Net Sales by Business Segment
Years Ended March 31
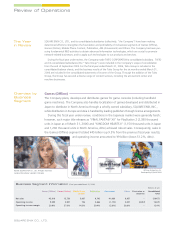
Games (Offline)
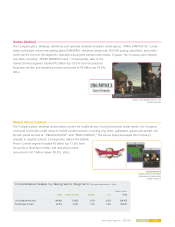
Games (Online)
Mobile Phone Content
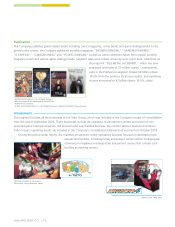
Publication
Amusement
Others
36.9%
12.6%
4.1%
7.8%
33.0%
5.6%
010 20 30 40 50
2006
2005
Net Sales (Billions of yen)Net Sales Ratio
Net Sales (Billions of yen)Net Sales Ratio
Net Sales (Billions of yen)Net Sales Ratio
Net Sales (Billions of yen)Net Sales Ratio
Net Sales (Billions of yen)Net Sales Ratio
Net Sales (Billions of yen)Net Sales Ratio
04 8 12 16 20
2006
2005
0246810
2006
2005
036 9 12 15
2006
2005
010 20 30 40 50
2006
2005
0246810
2006
2005
9.5%
13.5%
11.2%
162.6%
10.3%
At a Glance