Square Enix 2006 Annual Report Download - page 20
Download and view the complete annual report
Please find page 20 of the 2006 Square Enix annual report below. You can navigate through the pages in the report by either clicking on the pages listed below, or by using the keyword search tool below to find specific information within the annual report.-
 1
1 -
2
-
3
-
4
-
5
-
6
-
7
-
8
-
9
-
 10
10 -
 11
11 -
 12
12 -
 13
13 -
 14
14 -
 15
15 -
 16
16 -
 17
17 -
 18
18 -
 19
19 -
 20
20 -
 21
21 -
 22
22 -
 23
23 -
 24
24 -
 25
25 -
 26
26 -
 27
27 -
 28
28 -
 29
29 -
 30
30 -
31
-
32
-
33
-
34
-
35
-
36
-
37
-
38
-
39
-
40
-
41
-
42
-
43
-
44
-
45
-
46
-
47
-
48
-
49
-
50
-
51
-
52
-
53
-
54
-
55
-
56
-
57
-
58
-
59
-
60
-
61
-
62
-
63
-
64
-
65
-
66
-
67
-
68
 |
 |

S Q U A R E E N IX C O . , L T D .
C o n s o lid a t e d S t a t e m e n t s o f In c o m e
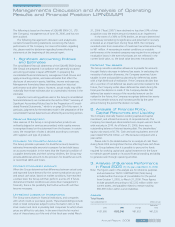
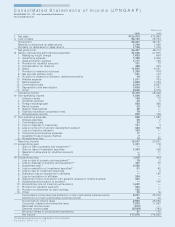
Net Sales and Operating Income
Years ended March 31 Millions of yen
2005 Composition 2006 Composition Amount change Percent change
Net sales ¥73,864 100.0% ¥124,473 100.0% ¥50,608 68.5%
Gross profit 48,161 65.2 56,367 45.2 42,402 88.0
Reversal of allowance for
sales returns 1,569 2.1 1,316 1.1 (253) (16.1)
Provision for allowance for
sales returns 1,316 1.8 1,186 0.1 (129) (9.8)
Net gross profit 48,414 65.5 56,497 45.4 8,082 16.7
Selling, general and
administrative expenses 21,975 29.7 41,026 33.0 19,051 86.7
Operating income 26,438 35.8 15,470 12.4 (10,968) (41.5)
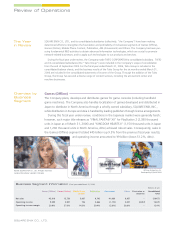
In the Games (Offline) business segment during the fiscal year
under review, conditions in the Japanese market remained harsh;
however, such major game title releases as “ FINAL FANTASY XII”
and “ Kingdom Hearts II” achieved robust sales, leading to an
increase in segment sales compared with the previous fiscal year. In
contrast, sales of second-tier titles were sluggish and conditions in
the operating environment prompted the Company to reevaluate
the content production account on an ongoing basis. Owing to
stringent evaluation of these assets, segment operating income
declined sharply compared with the previous fiscal year.
In the Games (Online) business segment, flagship game title
“ FINAL FANTASY XI” continued to perform strongly, leading to
higher sales and operating income for the segment.
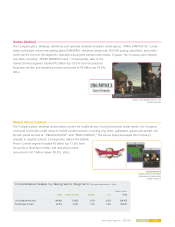
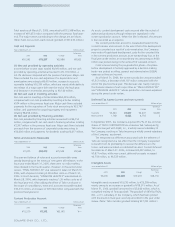
The Mobile Phone Content business segment achieved an
increase in sales. However, owing to a delay in revenue contribu-
tions from the segment’s overseas operations and initial invest-
ments made in the domestic market in the second half of the
period, which had yet to be recouped, costs outstripped sales
growth, leading to a decrease in segment operating income.
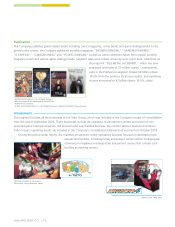
In the Publication business segment, in the absence of such
major hits as “ FULL METAL ALCHEMIST” and top-selling game
strategy books such as those related to “ DRAGON QUEST VIII,”
which were a feature of the previous fiscal year’s results, segment
sales and operating income declined. In contrast, magazine and
comic book sales were firm, providing a stable source of income.
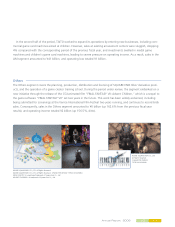
In the Others business segment, during the fiscal year under
review the success of the CGI-animated film FINAL FANTASY VII:
Advent Children led to a substantial increase in segment sales and
operating income.
The operating results for Taito, which was included in the scope
of consolidation from the end of September 2005, are presented in
the Amusement business segment. These results apply to the
period from October 1, 2005, to March 31, 2006.
The Amusement business segment was projected to contribute
to consolidated operating income; however, the commercial children’s
card game machine business, which Taito entered in the second
half of the period, performed poorly, and both new and existing
game center facilities posted sales below the level achieved in the
previous fiscal year. As a result, the segment posted an operating
loss for the six-month period.
For a breakdown of segment sales and operating income and comparison with the previous fiscal year, please refer to the Review of
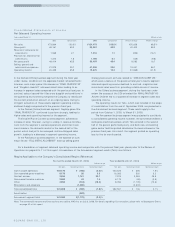
Operations on pages 8 to 11 of this report. A breakdown of the Amusement segment results (Taito) is as follows.
Results Applicable to the Company’s Consolidated Results (Reference)
Six months ended March 31, 2006 Year ended March 31, 2006
Millions of yen Millions of yen
Net sales Operating income Operating margin Net sales Operating income Operating margin
Game arcade operations ¥22,179 ¥0,(188) (0.9)% ¥43,526 ¥(0,656 1.5%
Coin-operated game machines 8,178 26 0.3 16,092 520 3.2
Content services 3,856 1,161 30.1 7,974 2,384 29.9
Commercial karaoke machines 2,999 43 1.4 6,175 (49) (0.8)
Other 3,854 (744) (19.3) 8,782 (1,105) (12.6)
Eliminations and corporate (1,086) (2,300)
Taito consolidated total ¥41,069 ¥0,(788) (1.9)% ¥82,551 ¥(0,106 0.1%
Amortization (382)
Amusement segment total ¥41,069 ¥(1,170) (2.8)%
Note: The commercial karaoke machines business was sold to XING Inc. on July 3, 2006. For details regarding this transaction, please refer to Subsequent Events
on page 42 of this report.