Square Enix 2006 Annual Report Download - page 41
Download and view the complete annual report
Please find page 41 of the 2006 Square Enix annual report below. You can navigate through the pages in the report by either clicking on the pages listed below, or by using the keyword search tool below to find specific information within the annual report.-
 1
1 -
2
-
3
-
4
-
5
-
6
-
7
-
8
-
9
-
10
-
11
-
12
-
13
-
14
-
15
-
16
-
17
-
18
-
19
-
20
-
21
-
22
-
23
-
24
-
25
-
26
-
27
-
28
-
29
-
30
-
 31
31 -
 32
32 -
 33
33 -
 34
34 -
 35
35 -
 36
36 -
 37
37 -
 38
38 -
 39
39 -
 40
40 -
 41
41 -
 42
42 -
 43
43 -
 44
44 -
 45
45 -
 46
46 -
 47
47 -
 48
48 -
 49
49 -
 50
50 -
 51
51 -
52
-
53
-
54
-
55
-
56
-
57
-
58
-
59
-
60
-
61
-
62
-
63
-
64
-
65
-
66
-
67
-
68
 |
 |
3 8 3 9
A n n u a l R e p o r t 2 0 0 6
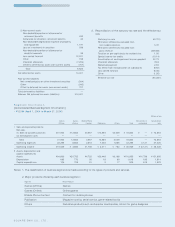
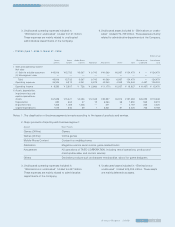
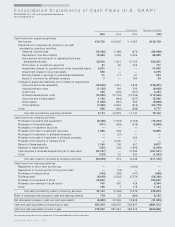
• FY2005 (April 1, 2005 to March 31, 2006)
Millions of yen
Games Games Mobile Phone Eliminations or Consolidated
(Offline) (Online) Content Publication Amusement Others Total unallocated total
I Sales and operating income
Net sales
(1) Sales to outside customers ¥45,916 ¥15,720 ¥5,067 ¥09,742 ¥41,069 ¥6,957 ¥124,473 ¥ — ¥124,473
(2) Intersegment sales —————————
Total 45,916 15,720 5,067 9,742 41,069 6,957 124,473 — 124,473
Operating expenses 36,326 9,812 4,341 6,875 42,240 4,949 104,545 4,457 109,003
Operating income ¥09,590 ¥05,907 ¥0,726 ¥02,866 ¥ (1,170) ¥2,007 ¥019,927 ¥ (4,457) ¥015,470
II Assets, depreciation,
impairment loss and
capital expenditures
Assets ¥67,658 ¥15,421 ¥4,056 ¥12,348 ¥80,897 ¥6,912 ¥187,293 ¥26,055 ¥213,348
Depreciation 690 663 47 15 6,364 68 7,850 569 8,419
Impairment loss 1,308 1,308 1,308 — 271 — 4,197 229 4,426
Capital expenditures 1,075 640 89 1 6,521 91 8,420 748 9,169
Notes: 1. The classification of business segments is made according to the types of products and services.
2. Major products offered by each business segment:
Segment M ajor Products
Games (Offline) Games
Games (Online) Online games
Mobile Phone Content Content for mobile phones
Publication Magazine comics, serial comics, game-related books
Amusement All operations of TAITO CORPORATION, including rental operations, product and
merchandise sales, and content services
Others Derivative products such as character merchandise, school for game designers
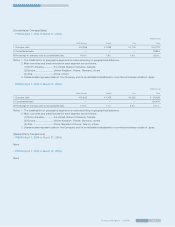
3. Unallocated operating expenses included in
“ Eliminations or unallocated” totaled ¥4,131 million.
These expenses are mainly related to unallocated
administrative departments of the Company.
4.Unallocated assets included in “ Eliminations or unallo-
cated” totaled ¥14,739 million. These assets are mainly
related to administrative departments of the Company.
3. Unallocated operating expenses included in
“ Eliminations or unallocated” totaled ¥4,457 million.
These expenses are mainly related to administrative
departments of the Company.
4. Unallocated assets included in “ Eliminations or
unallocated” totaled ¥26,055 million. These assets
are mainly deferred tax assets.