Square Enix 2006 Annual Report Download - page 55
Download and view the complete annual report
Please find page 55 of the 2006 Square Enix annual report below. You can navigate through the pages in the report by either clicking on the pages listed below, or by using the keyword search tool below to find specific information within the annual report.-
 1
1 -
2
-
3
-
4
-
5
-
6
-
7
-
8
-
9
-
10
-
11
-
12
-
13
-
14
-
15
-
16
-
17
-
18
-
19
-
20
-
21
-
22
-
23
-
24
-
25
-
26
-
27
-
28
-
29
-
30
-
31
-
32
-
33
-
34
-
35
-
36
-
37
-
38
-
39
-
40
-
41
-
42
-
43
-
44
-
 45
45 -
 46
46 -
 47
47 -
 48
48 -
 49
49 -
 50
50 -
 51
51 -
 52
52 -
 53
53 -
 54
54 -
 55
55 -
 56
56 -
 57
57 -
 58
58 -
 59
59 -
 60
60 -
 61
61 -
 62
62 -
 63
63 -
 64
64 -
 65
65 -
66
-
67
-
68
 |
 |

5 2 5 3
A n n u a l R e p o r t 2 0 0 6
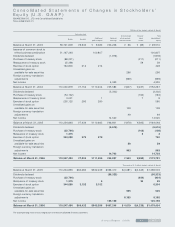
In June 2005, the stockholders of the Company approved
the Company’s Stock Option Plan, pursuant to which, officers,
directors, employees of the Company may purchase up to an
aggregate of 909,000 shares of common stock. This plan
expires in the year of 2010.
As of March 31, 2006, 2005 and 2004, the plans had out-
standing stock options totaling 3,418,710, 3,258,775 and
3,262,645 shares of the Company’s common stock, respectively.
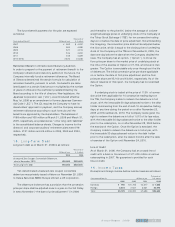
The following table summarizes the activities in options
under the plans:
Weighted-
Number average
of shares exercise price
Options outstanding—March 31, 2004 3,262,645 ¥3,001.17
Granted—exercise price equal to fair value 580,000 2,981.00
Granted—exercise less than fair value — —
Exercised 255,125 2,186.14
Forfeited 328,745 2,964.57
Options outstanding—March 31, 2005 3,258,775 ¥3,065.08
Granted—exercise price equal to fair value 909,000 3,364.96
Granted—exercise less than fair value — —
Exercised 344,080 2,152.00
Forfeited 404,985 7,318.47
Options outstanding—March 31, 2006 3,418,710 ¥2,732.85
At March 31, 2006, 2005 and 2004, the number of options
exercisable was 346,242, 660,595 and 723,397, respectively,
and their related weighted average exercise prices were
¥2,732.85, ¥3,065.08 and ¥3,001.17, respectively.
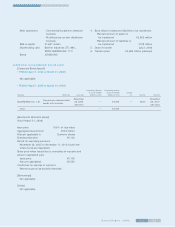
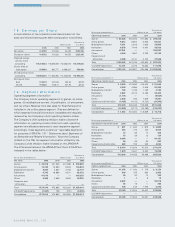
Had compensation cost for the Company’s stock option
plan been determined based on the fair value at the grant date
for awards in 2006, 2005 and 2004, consistent with the provi-
sions of SFAS No.123, the Company’s net income and the net
income per share would have been reduced to the pro forma
amounts indicated below.
Thousands of
Millions of yen U.S. dollars
(Except share data)
Years ended March 31
2006 2005 2004 2006
Net income:
As reported ¥14,702 ¥14,520 ¥4,355 $125,159
Deduct: Total stock-based
employee compensation
expense determined
under fair value based
method for all awards 716 387 — 6,096
Pro forma net income ¥13,986 ¥14,133 ¥4,355 $119,063
Earnings per share:
As reported—Basic ¥133.15 ¥131.89 ¥39.58 $1.13
Pro forma—Basic 126.67 128.38 — 1.08
As reported—Diluted ¥132.46 ¥130.74 ¥37.99 $1.13
Pro forma—Diluted 126.01 127.26 — 1.07
The pro forma disclosures shown are not representative of
the effects on net income and the net income per share in
future years.
The fair value of the Company’s stock options used to com-
pute pro forma net income and the net income per share dis-
closures is the estimated present value at the grant date using
the Black-Scholes option-pricing model. The weighted average
fair values of options granted were ¥787.67 and ¥666.56 for
the years ended March 31, 2006 and 2005, respectively. The
following weighted average assumptions for the years ended
March 31, 2006 and 2005 were used to value grants, respec-
tively: expected volatilities of 32.16 and 28.33 percent; risk-free
interest rates of 0.524 and 0.715 percent; and expected holding
periods of 4.9 and 4.8 years.
Earnings Per Share
Basic earnings per share (“ EPS” ) are computed by dividing the
net income (loss) applicable to common stockholders for the
year by the weighted-average number of common shares out-
standing during the year. Diluted EPS is computed by dividing
the net income (loss) applicable to common stockholders for
the year by the weighted-average number of common and
common stock equivalents, which include common shares
issuable upon the exercise of stock options outstanding during
the year. Common stock equivalents are excluded from the
computation if their effect is antidilutive.
Derivative Instruments
The Company adopted SFAS No. 133, “ Accounting for Deriva-
tive Instruments and Hedging Activities,” as amended by SFAS
No. 138, “ Accounting for Certain Derivative Instruments and
Certain Hedging Activities—an amendment of FASB Statement
No. 133,” and by SFAS No. 149, “ Amendment of SFAS No. 133
on Derivative Instruments and Hedging Activities.” Under SFAS
No. 133, all derivative instruments are recognized in the balance
sheet at their fair values and changes in fair value are recog-
nized immediately in earnings, unless the derivatives qualify
as hedges of future cash flows. For derivatives qualifying as
hedges of future cash flows, the effective portion of changes
in fair value is recorded in other comprehensive income, then
recognized in earnings along with the related effects of the
hedged items. Any ineffective portion of hedges is reported
in earnings as it occurs.
Derivative instruments to be utilized by the Company are
forward exchange contracts and currency options. The Com-
pany uses derivatives for hedging purpose only and does not
intend to hold or issue derivative financial instruments for trad-
ing purposes. No material derivatives were used for the years
ended March 31, 2006, 2005 and 2004.