Square Enix 2006 Annual Report Download - page 59
Download and view the complete annual report
Please find page 59 of the 2006 Square Enix annual report below. You can navigate through the pages in the report by either clicking on the pages listed below, or by using the keyword search tool below to find specific information within the annual report.-
 1
1 -
2
-
3
-
4
-
5
-
6
-
7
-
8
-
9
-
10
-
11
-
12
-
13
-
14
-
15
-
16
-
17
-
18
-
19
-
20
-
21
-
22
-
23
-
24
-
25
-
26
-
27
-
28
-
29
-
30
-
31
-
32
-
33
-
34
-
35
-
36
-
37
-
38
-
39
-
40
-
41
-
42
-
43
-
44
-
45
-
46
-
47
-
48
-
 49
49 -
 50
50 -
 51
51 -
 52
52 -
 53
53 -
 54
54 -
 55
55 -
 56
56 -
 57
57 -
 58
58 -
 59
59 -
 60
60 -
 61
61 -
 62
62 -
 63
63 -
 64
64 -
 65
65 -
 66
66 -
 67
67 -
 68
68
 |
 |

5 6 5 7
A n n u a l R e p o r t 2 0 0 6
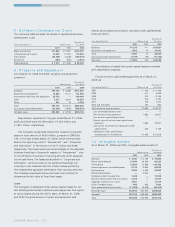
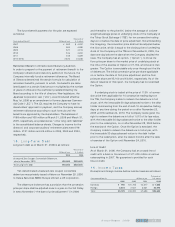
Amortization expenses for the years ended March 31, 2006,
2005 and 2004 were ¥1,924 million, ¥3,021 million and ¥3,775
million, respectively.
Expected annual amortization expenses for the ensuing
fiscal years are as follows:
Thousands of
Years ending March 31 Millions of yen U.S. dollars
2007 ¥03,529 $030,043
2008 2,139 18,209
2009 1,987 16,915
2010 1,289 10,977
2011 1,140 9,704
2012 and thereafter 4,305 36,643
Total ¥14,389 $122,491
The Company evaluates the recoverability of the carrying
value of goodwill under SFAS No. 142. The Company engages
an independent appraiser to assist management in its determi-
nation of the fair values of goodwill. In its determination of the
fair values, the appraiser primarily utilizes a discounted cash
flow analysis as well as other valuation approaches including
comparison of multiples indicated by the stock price and market
capitalization of comparable companies, and asset and liability
structure of the acquired subsidiaries. Significant assumptions
used in this analysis included 1) expected future revenue
growth rates, profit margins and working capital levels of the
acquired subsidiaries, 2) a discount rate, and 3) a terminal value
multiples. The revenue growth rates, profit margins and working
capital levels are based on management’s expectation of future
results. In evaluating the recoverability of other intangible
assets, the Company primarily utilizes a discounted cash flow
analysis as well as other applicable valuation approaches, and
if applicable, independent valuations.
At the end of fiscal year 2006, the Company determined
that the fair values of goodwill and intangible assets associated
with the acquisition of UIEvolution were lower than their carrying
values. The Company’s management reviewed the cash flow
projection of UIEvolution to evaluate the value thereof with the
discounted cash flow analysis, and concluded that goodwill and
intangibles associated with acquisition of UIEvolution were not
expected to be recoverable in the foreseeable future. Accord-
ingly, impairment charges for goodwill and intangible assets in
the amount of ¥3,331 and ¥2,190, respectively, associated with
the reportable unit of “ Mobilephone content” were recognized
in the year ended March 31, 2006. These impairment losses
were attributable to the difficulty of prediction of UIEvolution’s
value growth due to the rapidly changing business environment
surrounding “ Mobilephone content” unit.
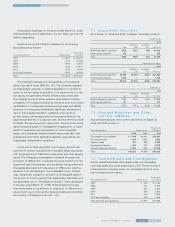
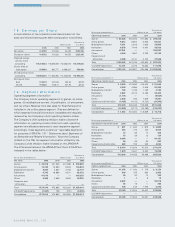
1 1 . In v e s t m e n t S e c u r it ie s
As of March 31, 2006 and 2005, investment securities consist of:
Millions of yen
2006
Unrealized Unrealized
Cost gain loss Fair value
Marketable equity securities ¥503 ¥827 ¥(4) ¥1,326
Other equity securities 133 — — 133
Total ¥636 ¥827 ¥(4) ¥1,459
Thousands of U.S. dollars
2006
Unrealized Unrealized
Cost gain loss Fair value
Marketable equity securities $4,280 $7,044 $(36) $11,288
Other equity securities 1,133 — — 1,133
Total $5,413 $7,044 $(36) $12,421
Millions of yen
2005
Unrealized Unrealized
Cost gain loss Fair value
Marketable equity securities ¥330 ¥741 ¥(18) ¥1,053
Other equity securities 242 — — 242
Total ¥572 ¥741 ¥(18) ¥1,295
1 2 . A c c r u e d E x p e n s e s a n d O t h e r
C u r r e n t L ia b ilit ie s
Accrued expenses and other current liabilities as of March 31,
2006 and 2005 consist of:
Thousands of
Years ended March 31 Millions of yen U.S. dollars
2006 2005 2006
Consumption taxes payable ¥01,246 ¥1,022 $10,606
Unearned revenue 1,159 1,057 3,586
Deposit receipt 421 385 9,869
Accrued paid absence 691 329 5,878
Accrued expenses and other 6,706 1,666 57,079
Total ¥10,223 ¥4,459 $87,018
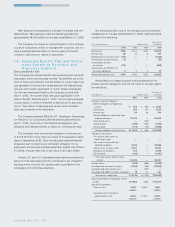
1 3 . C o m m it m e n t s a n d C o n t in g e n c ie s
Certain subsidiaries lease office space under non-cancelable
operating leases that expire beginning in 2007. Future minimum
rental payments required under non-cancelable terms of more
than one year are as follows:
Thousands of
Years ending March 31 Millions of yen U.S. dollars
2007 ¥0,439 $03,734
2008 412 3,510
2009 297 2,524
2010 266 2,262
2011 240 2,039
2012 and thereafter 225 1,916
Total minimum lease payments ¥1,879 $15,985