Square Enix 2006 Annual Report Download - page 42
Download and view the complete annual report
Please find page 42 of the 2006 Square Enix annual report below. You can navigate through the pages in the report by either clicking on the pages listed below, or by using the keyword search tool below to find specific information within the annual report.-
 1
1 -
2
-
3
-
4
-
5
-
6
-
7
-
8
-
9
-
10
-
11
-
12
-
13
-
14
-
15
-
16
-
17
-
18
-
19
-
20
-
21
-
22
-
23
-
24
-
25
-
26
-
27
-
28
-
29
-
30
-
31
-
 32
32 -
 33
33 -
 34
34 -
 35
35 -
 36
36 -
 37
37 -
 38
38 -
 39
39 -
 40
40 -
 41
41 -
 42
42 -
 43
43 -
 44
44 -
 45
45 -
 46
46 -
 47
47 -
 48
48 -
 49
49 -
 50
50 -
 51
51 -
 52
52 -
53
-
54
-
55
-
56
-
57
-
58
-
59
-
60
-
61
-
62
-
63
-
64
-
65
-
66
-
67
-
68
 |
 |

S Q U A R E E N IX C O . , L T D .
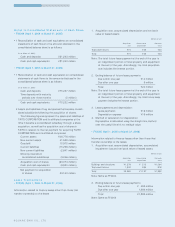
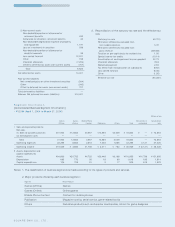
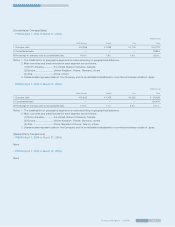
[Consolidated Geographic Segment Information]
• FY2004 (April 1, 2004 to March 31, 2005)
Millions of yen
North Eliminations or Consolidated
Japan America Europe Asia Total unallocated total
I Sales and operating income
Net sales
(1) Sales to outside customers ¥060,949 ¥11,528 ¥0,577 ¥0,810 ¥073,864 ¥ — ¥073,864
(2) Intersegment sales 3,436 360 312 13 4,123 (4,123) —
Total 64,386 11,889 889 823 77,988 (4,123) 73,864
Operating expenses 40,425 9,619 858 646 51,550 (4,123) 47,426
Operating income ¥023,960 ¥02,270 ¥0,031 ¥0,176 ¥026,438 ¥ — ¥026,438
II Assets ¥118,306 ¥10,694 ¥1,010 ¥1,683 ¥131,695 ¥ — ¥131,695
Notes: 1. The classification of geographic segments is made according to geographical distances.
2. Main countries and areas included in each segment are as follows:
(1) North America..............the United States of America
(2) Europe .........................United Kingdom
(3) Asia..............................China
3. There are no unallocated operating expenses included in “ Eliminations or unallocated.”
4. There are no unallocated assets included in “ Eliminations or unallocated.”
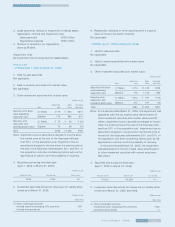
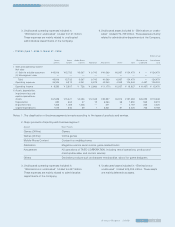
• FY2005 (April 1, 2005 to March 31, 2006)
Millions of yen
North Eliminations or Consolidated
Japan America Europe Asia Total unallocated total
I Sales and operating income
Net sales
(1) Sales to outside customers ¥107,354 ¥14,670 ¥0,413 ¥2,035 ¥124,473 ¥ — ¥124,473
(2) Intersegment sales 4,316 837 364 5 5,523 (5,523) —
Total 111,670 15,507 778 2,040 129,997 (5,523) 124,473
Operating expenses 99,910 12,109 728 1,778 114,526 (5,523) 109,003
Operating income ¥011,760 ¥03,398 ¥0,049 ¥0,262 ¥015,470 ¥ — ¥015,470
II Assets ¥196,210 ¥12,683 ¥1,207 ¥3,247 ¥213,348 ¥ — ¥213,348
Notes: 1. The classification of geographic segments is made according to geographical distances.
2. Main countries and areas included in each segment are as follows:
(1) North America..............the United States of America
(2) Europe .........................United Kingdom
(3) Asia..............................China, Republic of Korea
3. There are no unallocated operating expenses included in “ Eliminations or unallocated.”
4. There are no unallocated assets included in “ Eliminations or unallocated.”