Square Enix 2006 Annual Report Download - page 50
Download and view the complete annual report
Please find page 50 of the 2006 Square Enix annual report below. You can navigate through the pages in the report by either clicking on the pages listed below, or by using the keyword search tool below to find specific information within the annual report.-
 1
1 -
2
-
3
-
4
-
5
-
6
-
7
-
8
-
9
-
10
-
11
-
12
-
13
-
14
-
15
-
16
-
17
-
18
-
19
-
20
-
21
-
22
-
23
-
24
-
25
-
26
-
27
-
28
-
29
-
30
-
31
-
32
-
33
-
34
-
35
-
36
-
37
-
38
-
39
-
 40
40 -
 41
41 -
 42
42 -
 43
43 -
 44
44 -
 45
45 -
 46
46 -
 47
47 -
 48
48 -
 49
49 -
 50
50 -
 51
51 -
 52
52 -
 53
53 -
 54
54 -
 55
55 -
 56
56 -
 57
57 -
 58
58 -
 59
59 -
 60
60 -
61
-
62
-
63
-
64
-
65
-
66
-
67
-
68
 |
 |

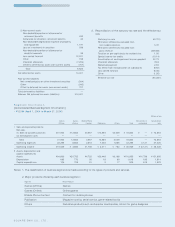
S Q U A R E E N IX C O . , L T D .
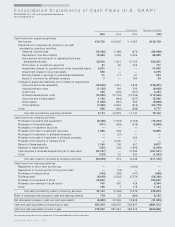
C o n s o lid a t e d S t a t e m e n t s o f C a s h F lo w s (U . S . G A A P )
SQUARE ENIX CO., LTD. and Consolidated Subsidiaries
Years ended March 31
Millions of yen Thousands of U.S. dollars
2006 2005 2004 2006
Cash flows from operating activities:
Net income ¥14,702 ¥14,520 ¥04,355 $125,159
Adjustments to reconcile net income to net cash
provided by operating activities:
Deferred income taxes (10,395) (1,486) (673) (88,489)
Depreciation and amortization 10,093 4,455 5,406 85,920
Amortization and write-off of capitalized software
developments costs 23,916 7,321 12,723 203,591
Write-down of investment securities 91 80 375 777
Impairment charge for goodwill and other intangible assets 5,521 —— 47,002
Impairment losses on long-lived assets 500 —— 4,275
Minority interest in earnings of consolidated subsidiaries 31 117 61 264
Equity in income of an affiliated company 7— 760 63
Changes in assets and liabilities, net of effects of acquisitions:
Accounts and notes receivable (15,039) 4,351 4,849 (128,021)
Accrued pension costs (1,135) 193 200 (9,658)
Inventories 402 (235) (437) 3,424
Software development costs (13,340) (12,704) (12,226) (113,550)
Accounts and notes payable 1,798 (948) (507) 15,306
Other assets (1,052) (281) 555 (8,959)
Other liabilities (7,492) 9,954 (916) (63,779)
Other 566 (462) (388) 4,777
Net cash provided by operating activities 9,174 24,875 14,137 78,102
Cash flows from investing activities:
Purchases of property and equipment (8,258) (1,319) (2,709) (70,303)
Purchases of intangible assets (341) (363) (416) (2,899)
Purchases of investment securities ——— —
Proceeds from sale of investment securities 1,505 248 — 12,809
Purchases of investment in affiliated company —(27) — —
Proceeds from sale of investment in affiliated company —— 423 —
Proceeds from maturity of treasury bond —2,000 — —
Refund of lease deposits 1,160 105 407 9,877
Payment of lease deposits (235) (102) (1,843) (2,000)
Cash acquired in business acquisitions (net of cash used) (53,747) — 12,095 (457,541)
Other (123) 32 292 (1,045)
Net cash (used in) provided by investing activities (60,039) 574 8,249 (511,102)
Cash flows from financing activities:
Repayment of short-term borrowings —— (1,000) —
Repayment of current portion of long term debt —(18) — —
Purchases of treasury stock (104) (155) (147) (889)
Dividends paid (6,618) (3,302) (2,574) (56,336)
Proceeds from issuance of bond 50,000 ——425,640
Proceeds from exercise of stock option 740 560 428 6,304
Other 136 7 719 1,154
Net cash provided by (used in) financing activities 44,154 (2,908) (2,574) 375,873
Effect of exchange rate changes on cash and cash equivalents 719 28 (984) 6,122
Net (decrease) increase in cash and cash equivalents (5,992) 22,569 18,828 (51,005)
Cash and cash equivalents at beginning of year ¥81,244 ¥58,675 ¥39,847 $691,613
Cash and cash equivalents at end of year ¥75,252 ¥81,244 ¥58,675 $640,608
The accompanying notes are an integral part of these consolidated financial statements.