Square Enix 2006 Annual Report Download - page 64
Download and view the complete annual report
Please find page 64 of the 2006 Square Enix annual report below. You can navigate through the pages in the report by either clicking on the pages listed below, or by using the keyword search tool below to find specific information within the annual report.-
 1
1 -
2
-
3
-
4
-
5
-
6
-
7
-
8
-
9
-
10
-
11
-
12
-
13
-
14
-
15
-
16
-
17
-
18
-
19
-
20
-
21
-
22
-
23
-
24
-
25
-
26
-
27
-
28
-
29
-
30
-
31
-
32
-
33
-
34
-
35
-
36
-
37
-
38
-
39
-
40
-
41
-
42
-
43
-
44
-
45
-
46
-
47
-
48
-
49
-
50
-
51
-
52
-
53
-
 54
54 -
 55
55 -
 56
56 -
 57
57 -
 58
58 -
 59
59 -
 60
60 -
 61
61 -
 62
62 -
 63
63 -
 64
64 -
 65
65 -
 66
66 -
 67
67 -
 68
68
 |
 |

S Q U A R E E N IX C O . , L T D .
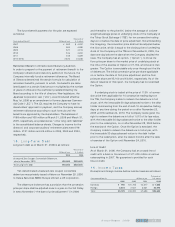
1 8 . E a r n in g s p e r S h a r e
A reconciliation of the numerators and denominators of the
basic and diluted earnings per share computation is as follows.
Thousands of
Millions of yen U.S. dollars
2006 2005 2004 2006
Net income ¥14,702 ¥14,520 ¥4,355 $125,159
Diluted net income ¥14,702 ¥14,520 ¥4,355 $125,159
Weighted-average
common shares
outstanding 110,419,003 110,093,589 110,030,879 110,419,003
Dilutive effect of:
Stock option 579,469 962,777 4,609,207 579,469
Diluted common shares
outstanding 110,998,472 111,056,366 114,640,086 110,998,472
Earnings per share:
Basic ¥133.15 ¥131.89 ¥39.58 $1.13
Diluted ¥132.46 ¥130.74 ¥37.99 $1.13
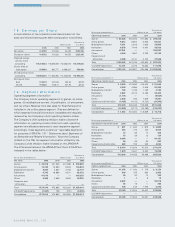
1 9 . S e g m e n t In f o r m a t io n
Operating segment information
The Company has six operating segments; (i) games, (ii) online
games, (iii) mobilephone content, (iv) publication, (v) amusement,
and (vi) others. Revenue from disc sales for Final Fantasy XI is
included in the online games segment. They are defined for
which separate financial information is available and regularly
reviewed by the Company’s chief operating decision maker.
The Company’s chief operating decision maker utilizes the
information on operating income (loss) from each operating
segment and allocates resources to each respective segment.
Accordingly, these segments constitute “ reportable segments”
for purposes of SFAS No. 131 “ Disclosures about Segments of
an Enterprise and Related Information”. Since the Company
is listed on the TSE, the segment information utilized by the
Company’s chief decision maker is based on the JPNGAAP.
The differences between the JPNGAAP and the U.S.GAAP are
indicated in the tables below:
Thousands of
For the years ended M arch 31 Millions of yen U.S. dollars
Net sales 2006 2005 2004 2006
Games ¥045,916 ¥41,945 ¥37,988 $0,390,880
Online games 15,720 13,853 8,924 133,824
Mobilephone Content 5,067 4,557 2,793 43,137
Publication 9,742 10,860 9,671 82,932
Amusement 41,070 ——349,620
Others 6,958 2,650 3,826 59,226
Corporate and
elimination ——— —
Total ¥124,473 ¥73,865 ¥63,202 $1,059,619
U.S.GAAP adjustments (1,057) 198 (107) (9,005)
Consolidated ¥123,416 ¥74,063 ¥63,095 $1,050,614
Thousands of
For the years ended M arch 31 Millions of yen U.S. dollars
Operating expenses 2006 2005 2004 2006
Games ¥036,326 ¥22,295 ¥21,583 $0,309,240
Online games 9,812 8,867 6,575 83,531
Mobilephone Content 4,341 2,818 1,633 36,955
Publication 6,875 7,448 6,491 58,530
Amusement 42,241 ——359,587
Others 4,950 1,867 2,799 42,135
Corporate and
elimination 4,458 4,131 4,722 37,946
Total ¥109,003 ¥47,426 ¥43,803 $0,927,924
U.S.GAAP adjustments 13,151 2,375 10,683 111,972
Consolidated ¥122,154 ¥49,801 ¥54,486 $1,039,896
Thousands of
For the years ended M arch 31 Millions of yen U.S. dollars
Operating income (loss) 2006 2005 2004 2006
Games ¥09,590 ¥19,650 ¥16,404 $081,640
Online games 5,908 4,986 2,348 50,293
Mobilephone Content 726 1,739 1,159 6,182
Publication 2,867 3,412 3,180 24,402
Amusement (1,171) ——(9,967)
Others 2,008 783 1,029 17,091
Corporate and elimination (4,458) (4,131) (4,722) (37,946)
Total ¥15,470 ¥26,439 ¥19,398 $131,695
U.S.GAAP adjustments (14,208) (2,177) (10,789) (120,977)
Consolidated ¥01,262 ¥24,262 ¥08,609 $010,718
Thousands of
For the years ended M arch 31 Millions of yen U.S. dollars
Depreciation and amortization
2006 2005 2004 2006
Games ¥00,691 ¥0,694 ¥0,870 $05,880
Online games 664 770 742 5,649
Mobilephone Content 47 36 17 404
Publication 15 20 12 129
Amusement 6,364 ——54,181
Others 69 99 94 587
Corporate and elimination 569 195 239 4,844
Total ¥08,419 ¥1,814 ¥1,974 $71,674
U.S.GAAP adjustments 1,674 2,641 3,432 14,246
Consolidated ¥10,093 ¥4,455 ¥5,406 $85,920
Thousands of
For the years ended M arch 31 Millions of yen U.S. dollars
Capital expenditures 2006 2005 2004 2006
Games ¥1,076 ¥0,106 ¥0,175 $09,159
Online games 640 725 384 5,450
Mobilephone Content 90 52 12 763
Publication 140 12
Amusement 6,522 ——55,519
Others 92 18 — 783
Corporate and elimination 748 619 1,976 6,370
Total ¥9,169 ¥1,524 ¥2,547 $78,056
U.S.GAAP adjustments ——— —
Consolidated ¥9,169 ¥1,524 ¥2,547 $78,056