Square Enix 2006 Annual Report Download - page 40
Download and view the complete annual report
Please find page 40 of the 2006 Square Enix annual report below. You can navigate through the pages in the report by either clicking on the pages listed below, or by using the keyword search tool below to find specific information within the annual report.-
 1
1 -
2
-
3
-
4
-
5
-
6
-
7
-
8
-
9
-
10
-
11
-
12
-
13
-
14
-
15
-
16
-
17
-
18
-
19
-
20
-
21
-
22
-
23
-
24
-
25
-
26
-
27
-
28
-
29
-
 30
30 -
 31
31 -
 32
32 -
 33
33 -
 34
34 -
 35
35 -
 36
36 -
 37
37 -
 38
38 -
 39
39 -
 40
40 -
 41
41 -
 42
42 -
 43
43 -
 44
44 -
 45
45 -
 46
46 -
 47
47 -
 48
48 -
 49
49 -
 50
50 -
51
-
52
-
53
-
54
-
55
-
56
-
57
-
58
-
59
-
60
-
61
-
62
-
63
-
64
-
65
-
66
-
67
-
68
 |
 |

S Q U A R E E N IX C O . , L T D .
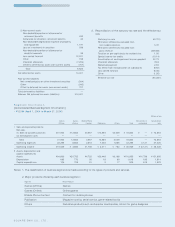
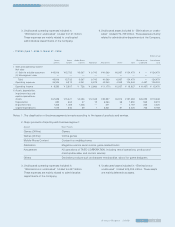
S e g m e n t In f o r m a t io n
[Consolidated Business Segment Information]
• FY2004 (April 1, 2004 to March 31, 2005)
Millions of yen
Games Games M obile Phone Eliminations or Consolidated
(Offline) (Online) Content Publication Others Total unallocated total
I Sales and operating income
Net sales
(1) Sales to outside customers ¥41,944 ¥13,853 ¥4,557 ¥10,859 ¥2,649 ¥073,864 ¥ — ¥073,864
(2) Intersegment sales ————————
Total 41,944 13,853 4,557 10,859 2,649 73,864 — 73,864
Operating expenses 22,295 8,866 2,818 7,448 1,866 43,295 4,131 47,426
Operating income ¥19,649 ¥04,986 ¥1,738 ¥03,411 ¥0,782 ¥030,569 ¥ (4,131) ¥026,438
II Assets, depreciation and
capital expenditures
Assets ¥64,860 ¥20,752 ¥4,725 ¥20,448 ¥6,168 ¥116,955 ¥14,739 ¥131,695
Depreciation 693 770 35 19 99 1,618 195 1,814
Capital expenditures 106 725 51 3 17 905 618 1,523
Notes: 1. The classification of business segments is made according to the types of products and services.
2. Major products offered by each business segment:
Segment M ajor Products
Games (Offline) Games
Games (Online) Online games
Mobile Phone Content Content for mobile phones
Publication Magazine comics, serial comics, game-related books
Others Derivative products such as character merchandise, school for game designers
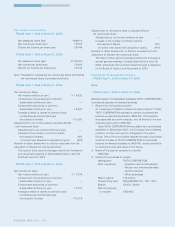
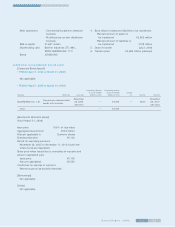
2) Non-current assets
Non-deductible portion of allowance for
retirement benefits 433
Allowance for directors’ retirement benefits 34
Non-deductible depreciation expense of property
and equipment 1,191
Loss on investments in securities 339
Non-deductible portion of allowance for
doubtful accounts 38
Loss carried forward 12,201
Other 198
Valuation allowance (7,206)
Offset to deferred tax assets (non-current assets) (707)
Total 6,523
Net deferred tax assets 14,401
Non-current liabilities
Net unrealized gains on other investment securities (364)
Other (342)
Offset to deferred tax assets (non-current assets) 707
Total deferred tax liabilities —
Balance: Net deferred tax assets (liabilities) ¥14,401
2. Reconciliation of the statutory tax rate and the effective tax
rate
Statutory tax rate 40.70%
Permanent differences excluded from
non-taxable expenses 0.72
Permanent differences excluded from
gross revenue (209.88)
Taxation on per capita basis for residents tax 1.05
Special income tax credits (10.14)
Amortization of and impairment loss on goodwill 22.73
Valuation allowance 78.8
Reclaimed payment 2.94
Tax effect from reorganization of subsidiaries (9.50)
Loss carried forward (6.35)
Other (1.35)
Effective tax rate (90.28)%