Square Enix 2006 Annual Report Download - page 36
Download and view the complete annual report
Please find page 36 of the 2006 Square Enix annual report below. You can navigate through the pages in the report by either clicking on the pages listed below, or by using the keyword search tool below to find specific information within the annual report.-
 1
1 -
2
-
3
-
4
-
5
-
6
-
7
-
8
-
9
-
10
-
11
-
12
-
13
-
14
-
15
-
16
-
17
-
18
-
19
-
20
-
21
-
22
-
23
-
24
-
25
-
 26
26 -
 27
27 -
 28
28 -
 29
29 -
 30
30 -
 31
31 -
 32
32 -
 33
33 -
 34
34 -
 35
35 -
 36
36 -
 37
37 -
 38
38 -
 39
39 -
 40
40 -
 41
41 -
 42
42 -
 43
43 -
 44
44 -
 45
45 -
 46
46 -
47
-
48
-
49
-
50
-
51
-
52
-
53
-
54
-
55
-
56
-
57
-
58
-
59
-
60
-
61
-
62
-
63
-
64
-
65
-
66
-
67
-
68
 |
 |

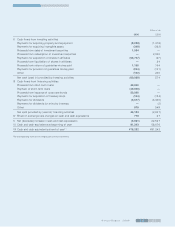
S Q U A R E E N IX C O . , L T D .
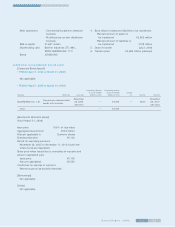
N o t e s t o C o n s o lid a t e d S t a t e m e n t s o f C a s h F lo w s
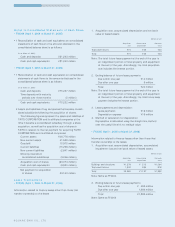
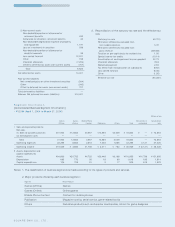
• FY2004 (April 1, 2004 to March 31, 2005)
*1 Reconciliation of cash and cash equivalents on consolidated
statements of cash flows to the amounts disclosed in the
consolidated balance sheet is as follows:
(As of March 31, 2005)
Cash and deposits ¥81,243 million
Cash and cash equivalents ¥81,243 million
• FY2005 (April 1, 2005 to March 31, 2006)
*1 Reconciliation of cash and cash equivalents on consolidated
statements of cash flows to the amounts disclosed in the
consolidated balance sheet is as follows:
(As of March 31, 2006)
Cash and deposits ¥75,257 million
Time deposits with maturity
periods over three months (5 million)
Cash and cash equivalents ¥75,252 million
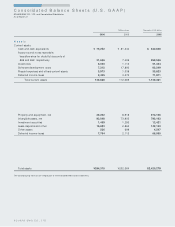
*2 Assets and liabilities of key companies that became consoli-
dated subsidiaries following the acquisition of shares.
The following figures represent the assets and liabilities of
TAITO CORPORATION and its affiliated companies at the
time it became a consolidated subsidiary through a share
acquisition, as well as the acquisition cost of shares in
TAITO in relation to the net payment for acquiring TAITO
CORPORATION and its affiliated companies:
Current assets ¥26,776 million
Non-current assets 41,508 million
Goodwill 15,975 million
Current liabilities (15,298 million)
Non-current liabilities (2,641 million)
Minority interests in
consolidated subsidiaries (3,246 million)
Acquisition cost of shares (63,074 million)
Cash and cash equivalents (9,930 million)
Net payment for acquisition
of shares 53,143 million
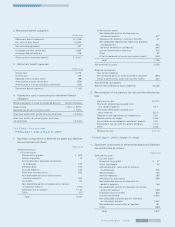
L e a s e T r a n s a c t io n s
• FY2004 (April 1, 2004 to March 31, 2005)
Information related to finance leases other than those that
transfer ownership to the lessee
1. Acquisition cost, accumulated depreciation and net book
value of leased assets:
Millions of yen
Acquisition Accumulated Net book
cost depreciation value
Tools and fixtures ¥74 ¥49 ¥24
Total ¥74 ¥49 ¥24
Note: The total future lease payment at the end of the year is
an insignificant portion of total property and equipment
at the end of the year. Accordingly, the total acquisition
cost includes the interest portion.
2. Ending balance of future lease payments:
Due within one year ¥14 million
Due after one year 9 million
Total ¥24 million
Note: The total future lease payment at the end of the year is
an insignificant portion of total property and equipment
at the end of the year. Accordingly, the total future lease
payment includes the interest portion.
3. Lease payments and depreciation:
Lease payments ¥16 million
Depreciation expense ¥16 million
4. Method of calculation for depreciation
Depreciation is calculated using the straight-line method
over the useful life with no residual value.
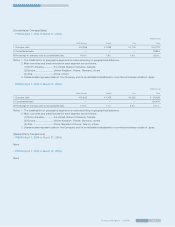
• FY2005 (April 1, 2005 to March 31, 2006)
Information related to finance leases other than those that
transfer ownership to the lessee
1. Acquisition cost, accumulated depreciation, accumulated
impairment loss and net book value of leased assets:
Millions of yen
Acquisition Accumulated Net book
cost depreciation value
Buildings and structures ¥1,278 ¥0,213 ¥1,064
Tools and fixtures 1,802 984 818
Total ¥3,080 ¥1,197 ¥1,882
Note: Same as FY2004
2. Ending balance of future lease payments:
Due within one year ¥0,493 million
Due after one year 1,389 million
Total ¥1,882 million
Note: Same as FY2004