SkyWest Airlines 2010 Annual Report Download - page 99
Download and view the complete annual report
Please find page 99 of the 2010 SkyWest Airlines annual report below. You can navigate through the pages in the report by either clicking on the pages listed below, or by using the keyword search tool below to find specific information within the annual report.-
 1
1 -
2
-
3
-
4
-
5
-
6
-
7
-
8
-
9
-
10
-
11
-
12
-
13
-
14
-
15
-
16
-
17
-
18
-
19
-
20
-
21
-
22
-
23
-
24
-
25
-
26
-
27
-
28
-
29
-
30
-
31
-
32
-
33
-
34
-
35
-
36
-
37
-
38
-
39
-
40
-
41
-
42
-
43
-
44
-
45
-
46
-
47
-
48
-
49
-
50
-
51
-
52
-
53
-
54
-
55
-
56
-
57
-
58
-
59
-
60
-
61
-
62
-
63
-
64
-
65
-
66
-
67
-
68
-
69
-
70
-
71
-
72
-
73
-
74
-
75
-
76
-
77
-
78
-
79
-
80
-
81
-
82
-
83
-
84
-
85
-
86
-
87
-
88
-
 89
89 -
 90
90 -
 91
91 -
 92
92 -
 93
93 -
 94
94 -
 95
95 -
 96
96 -
 97
97 -
 98
98 -
 99
99 -
 100
100 -
 101
101 -
 102
102 -
 103
103 -
 104
104 -
 105
105 -
 106
106 -
 107
107 -
 108
108 -
 109
109 -
110
-
111
-
112
-
113
-
114
-
115
-
116
-
117
-
118
-
119
-
120
-
121
-
122
-
123
-
124
-
125
-
126
-
127
-
128
-
129
-
130
-
131
-
132
-
133
-
134
-
135
-
136
-
137
-
138
-
139
-
140
-
141
-
142
-
143
-
144
-
145
-
146
-
147
-
148
-
149
-
150
-
151
-
152
-
153
-
154
-
155
-
156
-
157
-
158
-
159
-
160
-
161
-
162
-
163
-
164
-
165
-
166
-
167
-
168
-
169
-
170
-
171
-
172
-
173
-
174
-
175
-
176
 |
 |

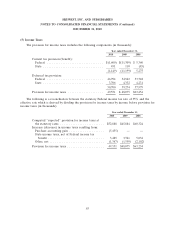
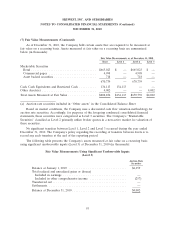
SKYWEST, INC. AND SUBSIDIARIES
NOTES TO CONSOLIDATED FINANCIAL STATEMENTS (Continued)
DECEMBER 31, 2010
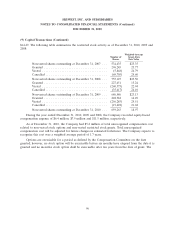
(9) Capital Transactions (Continued)
The fair value of stock options awarded under the Company’s stock option plans has been
estimated as of the grant date using the Black-Scholes option pricing model. The Company uses
historical data to estimate option exercises and employee termination in the option pricing model. The
expected term of options granted is derived from the output of the option pricing model and represents
the period of time that options granted are expected to be outstanding. The expected volatilities are
based on the historical volatility of the Company’s traded stock and other factors. During the year
ended December 31, 2010, the Company granted 320,458 stock options to employees under the 2006
Incentive Plan. The following table shows the assumptions used and weighted average fair value for
grants in the years ended December 31, 2010, 2009 and 2008.
2010 2009 2008
Expected annual dividend rate ..................... 1.10% 1.05% 0.47%
Risk-free interest rate ........................... 1.88% 1.67% 2.39%
Average expected life (years) ...................... 4.6 4.6 4.3
Expected volatility of common stock ................ 0.402 0.351 0.264
Forfeiture rate ................................ 0.0% 1.0% 4.4%
Weighted average fair value of option grants .......... $ 4.78 $ 4.42 $ 6.32
The Company recorded share-based compensation expense only for those options that are
expected to vest. The estimated fair value of the stock options is amortized over the vesting period of
the respective stock option grants.
During the year ended December 31, 2010, the Company granted 220,779 shares of restricted stock
to the Company’s employees under the 2006 Incentive Plan. The restricted stock has a three-year
vesting period, during which the recipient must remain employed with the Company or its subsidiaries.
The weighted average fair value of the restricted stock on the date of grants made during the year
ended December 31, 2010 was $14.49 per share. Additionally, the Company granted 27,605 fully-vested
shares of common stock to the Company’s directors with a weighted average grant-date fair value of
95