SkyWest Airlines 2010 Annual Report Download - page 58
Download and view the complete annual report
Please find page 58 of the 2010 SkyWest Airlines annual report below. You can navigate through the pages in the report by either clicking on the pages listed below, or by using the keyword search tool below to find specific information within the annual report.-
 1
1 -
2
-
3
-
4
-
5
-
6
-
7
-
8
-
9
-
10
-
11
-
12
-
13
-
14
-
15
-
16
-
17
-
18
-
19
-
20
-
21
-
22
-
23
-
24
-
25
-
26
-
27
-
28
-
29
-
30
-
31
-
32
-
33
-
34
-
35
-
36
-
37
-
38
-
39
-
40
-
41
-
42
-
43
-
44
-
45
-
46
-
47
-
 48
48 -
 49
49 -
 50
50 -
 51
51 -
 52
52 -
 53
53 -
 54
54 -
 55
55 -
 56
56 -
 57
57 -
 58
58 -
 59
59 -
 60
60 -
 61
61 -
 62
62 -
 63
63 -
 64
64 -
 65
65 -
 66
66 -
 67
67 -
 68
68 -
69
-
70
-
71
-
72
-
73
-
74
-
75
-
76
-
77
-
78
-
79
-
80
-
81
-
82
-
83
-
84
-
85
-
86
-
87
-
88
-
89
-
90
-
91
-
92
-
93
-
94
-
95
-
96
-
97
-
98
-
99
-
100
-
101
-
102
-
103
-
104
-
105
-
106
-
107
-
108
-
109
-
110
-
111
-
112
-
113
-
114
-
115
-
116
-
117
-
118
-
119
-
120
-
121
-
122
-
123
-
124
-
125
-
126
-
127
-
128
-
129
-
130
-
131
-
132
-
133
-
134
-
135
-
136
-
137
-
138
-
139
-
140
-
141
-
142
-
143
-
144
-
145
-
146
-
147
-
148
-
149
-
150
-
151
-
152
-
153
-
154
-
155
-
156
-
157
-
158
-
159
-
160
-
161
-
162
-
163
-
164
-
165
-
166
-
167
-
168
-
169
-
170
-
171
-
172
-
173
-
174
-
175
-
176
 |
 |
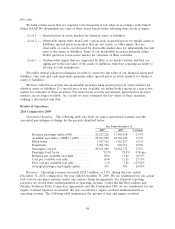
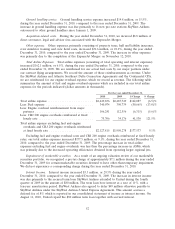
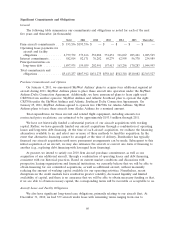
Passenger revenues. Passenger revenues decreased $884.0 million, or 25.5%, during the year ended
December 31, 2009, compared to the year ended December 31, 2008. The decrease in passenger
revenues was primarily due to a decrease in fuel reimbursements from our major partners. The fuel
reimbursement from our major partners decreased $824.9 million or 69.6%, during the year ended
December 31, 2009, compared to the year ended December 31, 2008. Our passenger revenues,
excluding fuel and engine overhaul reimbursements from major partners, decreased $51.6 million, or
2.4%, during the year ended December 31, 2009, compared to the year ended December 31, 2008. The
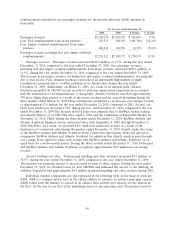
percentage decrease in passenger revenues, excluding fuel and engine overhaul reimbursements, was
more than the percentage increase in ASMs, primarily due to three factors. First, Atlantic Southeast
experienced an abnormally high number of flight cancellations in part due to significant weather related
cancellations in its Atlanta hub during the three months ended March 31, 2009. Additionally, on
March 31, 2009, as a result of an internal audit, Atlantic Southeast grounded 60 CRJ200s in order to
perform engine safety inspections in accordance with the manufacturer’s recommendations. Atlantic
Southeast cancelled approximately 750 scheduled flights as a result of the severe weather and aircraft
grounding during the first quarter of 2009. As a result, Atlantic Southeast experienced a negative
impact on passenger revenues of approximately $7.6 million. Second, Delta transitioned ground
handling services at 23 stations from SkyWest Airlines and Atlantic Southeast to other ground handlers
during the second quarter of 2009. Revenue earned under ground handling contracts where we provide
ground handling services for our own aircraft is presented in the ‘‘Passenger revenue’’ line in our
consolidated statements of income. Third, on October 23, 2009, Delta sent letters to SkyWest Airlines
and Atlantic Southeast requiring them to either adjust the rates payable under their respective Delta
Connection Agreements or accept termination of those agreements Delta’s letter also notified SkyWest
Airlines and Atlantic Southeast of Delta’s estimate of the average rates to be applied under those
agreements. On October 28, 2009, SkyWest Airlines and Atlantic Southeast notified Delta of their
election to adjust the rates payable under the Delta Connection Agreements; however, they also
notified Delta of their disagreement with Delta’s estimated rates and their belief that the methodology
Delta used to calculate its estimated rates is inconsistent with the terms of the Delta Connection
Agreements. Because SkyWest Airlines and Atlantic Southeast had not reached an agreement with
Delta regarding the final contractual rates to be established under the Delta Connection Agreements as
of December 31, 2009, we evaluated the method for calculating the average rate of the carriers within
the Delta Connection Program under the revenue recognition accounting guidance and recorded
revenue under those agreements based on management’s understanding of the applicable terms in the
Delta Connection Agreements and management’s best estimate of the revenue that would ultimately be
realized upon settlement of the contractual rates with Delta with respect to the year ended
December 31, 2009. SkyWest Airlines and Atlantic Southeast reached an agreement with Delta related
to the average rate provisions in November 2010.
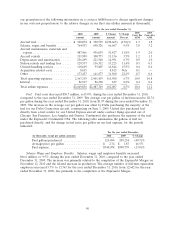
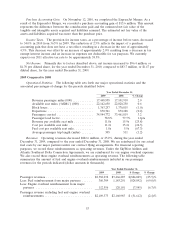
Ground handling and other. Total ground handling and other revenues increased $1.4 million, or
4.7%, during the year ended December 31, 2009, compared to the year ended December 31, 2008.
Revenue earned under other ground handling contracts where we provide ground handling services for
other airlines is presented in the ‘‘Ground handling and other’’ line in our consolidated statements of
income. The increase was primarily related to the higher volume of flights serviced under ground
handling contracts with United and Delta during 2009, whereby we performed ground handling services
for several other regional airlines.
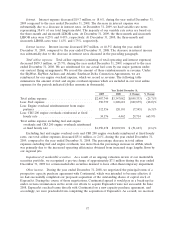
Individual expense components for the periods indicated are expressed in the following table on
the basis of cents per ASM. ASM is a common metric used in the airline industry to measure an
airline’s passenger capacity. ASMs reflect both the number of aircraft in an airline’s fleet and the seat
capacity for the aircraft in the fleet. As the size of our fleet is the underlying driver of our operating
costs, the primary basis for our presentation in this Item 7 is on a cost per ASM basis to discuss
54