SkyWest Airlines 2010 Annual Report Download - page 77
Download and view the complete annual report
Please find page 77 of the 2010 SkyWest Airlines annual report below. You can navigate through the pages in the report by either clicking on the pages listed below, or by using the keyword search tool below to find specific information within the annual report.-
 1
1 -
2
-
3
-
4
-
5
-
6
-
7
-
8
-
9
-
10
-
11
-
12
-
13
-
14
-
15
-
16
-
17
-
18
-
19
-
20
-
21
-
22
-
23
-
24
-
25
-
26
-
27
-
28
-
29
-
30
-
31
-
32
-
33
-
34
-
35
-
36
-
37
-
38
-
39
-
40
-
41
-
42
-
43
-
44
-
45
-
46
-
47
-
48
-
49
-
50
-
51
-
52
-
53
-
54
-
55
-
56
-
57
-
58
-
59
-
60
-
61
-
62
-
63
-
64
-
65
-
66
-
 67
67 -
 68
68 -
 69
69 -
 70
70 -
 71
71 -
 72
72 -
 73
73 -
 74
74 -
 75
75 -
 76
76 -
 77
77 -
 78
78 -
 79
79 -
 80
80 -
 81
81 -
 82
82 -
 83
83 -
 84
84 -
 85
85 -
 86
86 -
 87
87 -
88
-
89
-
90
-
91
-
92
-
93
-
94
-
95
-
96
-
97
-
98
-
99
-
100
-
101
-
102
-
103
-
104
-
105
-
106
-
107
-
108
-
109
-
110
-
111
-
112
-
113
-
114
-
115
-
116
-
117
-
118
-
119
-
120
-
121
-
122
-
123
-
124
-
125
-
126
-
127
-
128
-
129
-
130
-
131
-
132
-
133
-
134
-
135
-
136
-
137
-
138
-
139
-
140
-
141
-
142
-
143
-
144
-
145
-
146
-
147
-
148
-
149
-
150
-
151
-
152
-
153
-
154
-
155
-
156
-
157
-
158
-
159
-
160
-
161
-
162
-
163
-
164
-
165
-
166
-
167
-
168
-
169
-
170
-
171
-
172
-
173
-
174
-
175
-
176
 |
 |

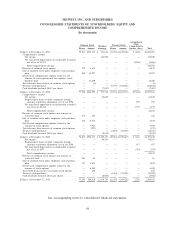
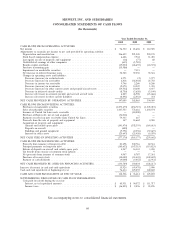
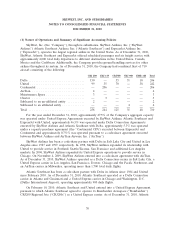
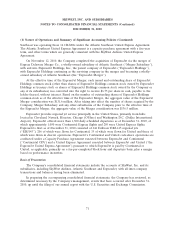
SKYWEST, INC. AND SUBSIDIARIES
NOTES TO CONSOLIDATED FINANCIAL STATEMENTS (Continued)
DECEMBER 31, 2010
(1) Nature of Operations and Summary of Significant Accounting Policies (Continued)
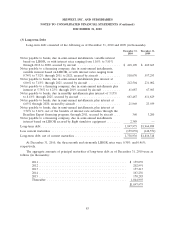
Marketable securities had the following maturities as of December 31, 2010 (in thousands):
Maturities Amount
Year 2011 ........................................ $296,051
Years 2012 through 2015 .............................. 216,249
Years 2016 through 2020 .............................. 2,710
Thereafter ........................................ 159,731
As of December 31, 2010, the Company had classified $670.7 million of marketable securities as
short-term since it has the intent to maintain a liquid portfolio and the ability to redeem the securities
within one year. The Company has classified approximately $4.0 million of investments as non-current
and has identified them as ‘‘Other assets’’ in the Company’s consolidated balance sheet as of
December 31, 2010 (see Note 7).
Inventories
Inventories include expendable parts, fuel and supplies and are valued at cost (FIFO basis) less an
allowance for obsolescence based on historical results and management’s expectations of future
operations. Expendable inventory parts are charged to expense as used. An obsolescence allowance for
flight equipment expendable parts is accrued based on estimated lives of the corresponding fleet types
and salvage values. The inventory allowance as of December 31, 2010 and 2009 was $7.5 million and
$6.6 million, respectively. These allowances are based on management estimates, which are subject to
change.
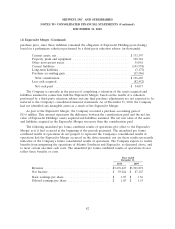
Property and Equipment
Property and equipment are stated at cost and depreciated over their useful lives to their
estimated residual values using the straight-line method as follows:
Depreciable Residual
Assets Life Value
Aircraft and rotable spares .............. 10 - 18 years 0 - 30%
Ground equipment .................... 5 - 10 years 0%
Office equipment ..................... 5 - 7 years 0%
Leasehold improvements ............... 15 years or life of the lease 0%
Buildings ........................... 20 - 39.5 years 0%
Change in Accounting Estimates
During the first quarter of 2009, the Company changed its estimate of depreciable lives on ground
equipment from five to seven years to five to ten years and maintained the residual value of zero
percent. The impact of this change increased the Company’s pre-tax income for the year ended
December, 31 2010 and 2009 by $2.9 million and $4.0 million, respectively. The impact of this change,
net of tax, increased the Company’s net income for the year ended December 31, 2010 and
December 31, 2009 by $1.7 million and $2.5 million ($.03 and $.05 per share Basic EPS and $.03 and
$.04 per share Diluted EPS), respectively.
73