SkyWest Airlines 2010 Annual Report Download - page 153
Download and view the complete annual report
Please find page 153 of the 2010 SkyWest Airlines annual report below. You can navigate through the pages in the report by either clicking on the pages listed below, or by using the keyword search tool below to find specific information within the annual report.-
 1
1 -
2
-
3
-
4
-
5
-
6
-
7
-
8
-
9
-
10
-
11
-
12
-
13
-
14
-
15
-
16
-
17
-
18
-
19
-
20
-
21
-
22
-
23
-
24
-
25
-
26
-
27
-
28
-
29
-
30
-
31
-
32
-
33
-
34
-
35
-
36
-
37
-
38
-
39
-
40
-
41
-
42
-
43
-
44
-
45
-
46
-
47
-
48
-
49
-
50
-
51
-
52
-
53
-
54
-
55
-
56
-
57
-
58
-
59
-
60
-
61
-
62
-
63
-
64
-
65
-
66
-
67
-
68
-
69
-
70
-
71
-
72
-
73
-
74
-
75
-
76
-
77
-
78
-
79
-
80
-
81
-
82
-
83
-
84
-
85
-
86
-
87
-
88
-
89
-
90
-
91
-
92
-
93
-
94
-
95
-
96
-
97
-
98
-
99
-
100
-
101
-
102
-
103
-
104
-
105
-
106
-
107
-
108
-
109
-
110
-
111
-
112
-
113
-
114
-
115
-
116
-
117
-
118
-
119
-
120
-
121
-
122
-
123
-
124
-
125
-
126
-
127
-
128
-
129
-
130
-
131
-
132
-
133
-
134
-
135
-
136
-
137
-
138
-
139
-
140
-
141
-
142
-
 143
143 -
 144
144 -
 145
145 -
 146
146 -
 147
147 -
 148
148 -
 149
149 -
 150
150 -
 151
151 -
 152
152 -
 153
153 -
 154
154 -
 155
155 -
 156
156 -
 157
157 -
 158
158 -
 159
159 -
 160
160 -
 161
161 -
 162
162 -
 163
163 -
164
-
165
-
166
-
167
-
168
-
169
-
170
-
171
-
172
-
173
-
174
-
175
-
176
 |
 |

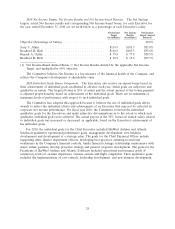
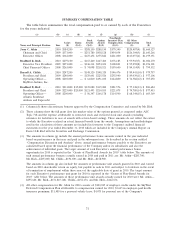
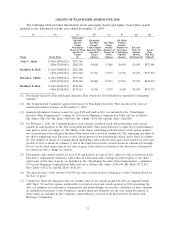
SUMMARY COMPENSATION TABLE
The table below summarizes the total compensation paid to or earned by each of the Executives
for the years indicated.
(a) (b) (c) (d) (e) (f) (g) (h) (i)
Non-Equity
Stock Option Incentive Plan All Other
Salary Bonus Awards Awards Compensation Compensation Total
Name and Principal Position Year ($) ($)(1) ($)(2) ($)(2) ($)(3) ($) ($)
Jerry C. Atkin ......... 2010 $384,200 — $288,150 $288,150 $579,340 $120,487(4) $1,660,327
Chairman and Chief 2009 $373,000 — $251,780 $438,128 $454,054 $126,304(5) $1,643,266
Executive Officer 2008 $362,000 — $127,452 $375,842 $221,000 $113,057(6) $1,199,351
Bradford R. Rich ....... 2010 $279,100 — $167,460 $167,460 $376,185 $ 95,965(7) $1,086,170
Executive Vice President, 2009 $271,000 — $146,334 $254,654 $308,821 $ 95,292(8) $1,076,101
Chief Financial Officer 2008 $263,000 — $ 74,098 $218,521 $159,600 $ 84,314(9) $ 799,532
Russell A. Childs ....... 2010 $247,200 — $148,320 $148,320 $346,476 $ 89,441(10) $ 979,757
President and Chief 2009 $240,000 — $129,601 $225,526 $292,940 $ 89,039(11) $ 977,106
Operating Officer— 2008 $230,000 — $ 64,810 $191,100 $144,800 $ 76,582(12) $ 707,292
SkyWest Airlines, Inc.
Bradford R. Holt ....... 2010 $231,800 $15,000 $139,080 $139,080 $281,576 $ 77,148(13) $ 883,684
President and Chief 2009 $225,000 $25,000 $121,493 $210,105 $221,075 $ 74,780(14) $ 877,453
Operating Officer— 2008 $200,000 — $ 56,347 $166,178 $114,500 $ 68,344(15) $ 605,369
Atlantic Southeast
Airlines and ExpressJet
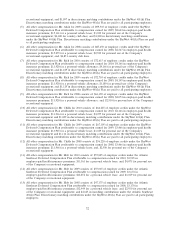
(1) Column (d) shows discretionary bonuses approved by the Compensation Committee and earned by Mr. Holt.
(2) These columns show the full grant date fair market value of the options granted as computed under ASC
Topic 718 and the expense attributable to restricted stock and restricted stock unit awards (excluding
estimates for forfeitures in case of awards with service-based vesting). These amounts do not reflect the extent
to which the Executive realized an actual financial benefit from the awards. Assumptions and methodologies
used in the calculation of these amounts are included in footnotes to the Company’s audited financial
statements for the year ended December 31, 2010 which are included in the Company’s Annual Report on
Form 10-K filed with the Securities and Exchange Commission.
(3) The amounts in column (g) include the annual performance bonus amounts earned in the year indicated
based on performance in that year and paid in the subsequent year. As described in the section entitled
‘‘Compensation Discussion and Analysis’’ above, annual performance bonuses payable to the Executives are
calculated based upon the financial performance of the Company and/or its subsidiaries and also the
achievement of individual goals. The target amount of each Executive’s annual performance bonus
opportunity for 2010 is reported in the ‘‘Grants of Plan-Based Awards for 2010’’ table below. The amounts of
such annual performance bonuses actually earned in 2010 and paid in 2011 are: Mr. Atkin—$283,700;
Mr. Rich—$205,000; Mr. Childs—$194,300; and Mr. Holt—$138,900.
The amounts in column (g) also include the amounts of performance unit awards granted in 2010 and earned
based on 2010 shareholder return on equity, but payable in cash in 2013 and subject to forfeiture in the event
of termination of employment within three years of the applicable date of grant in 2010. The target amount
for each Executive’s performance unit grant for 2010 is reported in the ‘‘Grants of Plan-Based Awards for
2010’’ table below. The amounts of those performance unit awards actually earned for 2010 were Mr. Atkin—
$295,640; Mr. Rich—$171,815; Mr. Childs—$152,176; and Mr. Holt—$142,676.
(4) All other compensation for Mr. Atkin for 2010 consists of: $100,185 of employer credits under the SkyWest
Deferred Compensation Plan attributable to compensation earned for 2010; $3,645 in employer-paid health
insurance premiums; $11,485 for a personal vehicle lease; $4,075 for personal use of the Company’s
31