SkyWest Airlines 2010 Annual Report Download - page 52
Download and view the complete annual report
Please find page 52 of the 2010 SkyWest Airlines annual report below. You can navigate through the pages in the report by either clicking on the pages listed below, or by using the keyword search tool below to find specific information within the annual report.-
 1
1 -
2
-
3
-
4
-
5
-
6
-
7
-
8
-
9
-
10
-
11
-
12
-
13
-
14
-
15
-
16
-
17
-
18
-
19
-
20
-
21
-
22
-
23
-
24
-
25
-
26
-
27
-
28
-
29
-
30
-
31
-
32
-
33
-
34
-
35
-
36
-
37
-
38
-
39
-
40
-
41
-
 42
42 -
 43
43 -
 44
44 -
 45
45 -
 46
46 -
 47
47 -
 48
48 -
 49
49 -
 50
50 -
 51
51 -
 52
52 -
 53
53 -
 54
54 -
 55
55 -
 56
56 -
 57
57 -
 58
58 -
 59
59 -
 60
60 -
 61
61 -
 62
62 -
63
-
64
-
65
-
66
-
67
-
68
-
69
-
70
-
71
-
72
-
73
-
74
-
75
-
76
-
77
-
78
-
79
-
80
-
81
-
82
-
83
-
84
-
85
-
86
-
87
-
88
-
89
-
90
-
91
-
92
-
93
-
94
-
95
-
96
-
97
-
98
-
99
-
100
-
101
-
102
-
103
-
104
-
105
-
106
-
107
-
108
-
109
-
110
-
111
-
112
-
113
-
114
-
115
-
116
-
117
-
118
-
119
-
120
-
121
-
122
-
123
-
124
-
125
-
126
-
127
-
128
-
129
-
130
-
131
-
132
-
133
-
134
-
135
-
136
-
137
-
138
-
139
-
140
-
141
-
142
-
143
-
144
-
145
-
146
-
147
-
148
-
149
-
150
-
151
-
152
-
153
-
154
-
155
-
156
-
157
-
158
-
159
-
160
-
161
-
162
-
163
-
164
-
165
-
166
-
167
-
168
-
169
-
170
-
171
-
172
-
173
-
174
-
175
-
176
 |
 |

Fair value
We hold certain assets that are required to be measured at fair value in accordance with United
States GAAP. We determined fair value of these assets based on the following three levels of inputs:
Level 1 — Quoted prices in active markets for identical assets or liabilities.
Level 2 — Observable inputs other than Level 1 prices such as quoted prices for similar assets or
liabilities; quoted prices in markets that are not active; or other inputs that are
observable or can be corroborated by observable market data for substantially the full
term of the assets or liabilities. Some of our marketable securities primarily utilize
broker quotes in a non-active market for valuation of these securities.
Level 3 — Unobservable inputs that are supported by little or no market activity and that are
significant to the fair value of the assets or liabilities, therefore requiring an entity to
develop its own assumptions.
We utilize several valuation techniques in order to assess the fair value of our financial assets and
liabilities. Our cash and cash equivalents primarily utilize quoted prices in active markets for identical
assets or liabilities.
We have valued non-auction rate marketable securities using quoted prices in active markets for
identical assets or liabilities. If a quoted price is not available, we utilize broker quotes in a non-active
market for valuation of these securities. For auction-rate security instruments, quoted prices in active
markets are no longer available. As a result, we have estimated the fair values of these securities
utilizing a discounted cash flow.
Results of Operations
2010 Compared to 2009
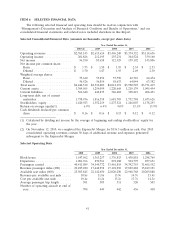
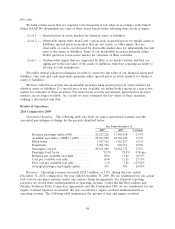
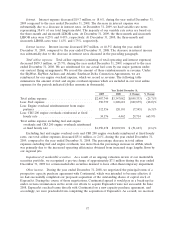
Operational Statistics. The following table sets forth our major operational statistics and the
associated percentages-of-change for the periods identified below.
Year Ended December 31,
2010 2009 % Change
Revenue passenger miles (000) ........... 20,227,220 17,448,958 15.9%
Available seat miles (‘‘ASMs’’) (000) ....... 25,503,845 22,142,650 15.2%
Block hours ......................... 1,547,562 1,363,257 13.5%
Departures ......................... 1,001,766 870,761 15.0%
Passengers carried .................... 40,411,089 34,544,772 17.0%
Passenger load factor .................. 79.3% 78.8% 0.50 pts
Revenue per available seat mile .......... 10.8¢ 11.8¢ (8.5)%
Cost per available seat mile ............. 10.4¢ 11.2¢ (7.1)%
Fuel cost per available seat mile .......... 1.3¢ 1.8¢ (27.8)%
Average passenger trip length (miles) ...... 501 505 (0.8)%
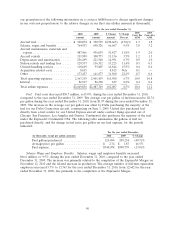
Revenues. Operating revenues increased $151.5 million, or 5.8%, during the year ended
December 31, 2010, compared to the year ended December 31, 2009. We are reimbursed for our actual
fuel costs by our major partners under our contract flying arrangements. For financial reporting
purposes, we record these reimbursements as operating revenue. Under the SkyWest Airlines and
Atlantic Southeast Delta Connection Agreements and the Continental CPA, we are reimbursed for our
engine overhaul expenses as incurred. We also record those engine overhaul reimbursements as
operating revenue. The following table summarizes the amount of fuel and engine overhaul
48