SkyWest Airlines 2010 Annual Report Download - page 44
Download and view the complete annual report
Please find page 44 of the 2010 SkyWest Airlines annual report below. You can navigate through the pages in the report by either clicking on the pages listed below, or by using the keyword search tool below to find specific information within the annual report.-
 1
1 -
2
-
3
-
4
-
5
-
6
-
7
-
8
-
9
-
10
-
11
-
12
-
13
-
14
-
15
-
16
-
17
-
18
-
19
-
20
-
21
-
22
-
23
-
24
-
25
-
26
-
27
-
28
-
29
-
30
-
31
-
32
-
33
-
 34
34 -
 35
35 -
 36
36 -
 37
37 -
 38
38 -
 39
39 -
 40
40 -
 41
41 -
 42
42 -
 43
43 -
 44
44 -
 45
45 -
 46
46 -
 47
47 -
 48
48 -
 49
49 -
 50
50 -
 51
51 -
 52
52 -
 53
53 -
 54
54 -
55
-
56
-
57
-
58
-
59
-
60
-
61
-
62
-
63
-
64
-
65
-
66
-
67
-
68
-
69
-
70
-
71
-
72
-
73
-
74
-
75
-
76
-
77
-
78
-
79
-
80
-
81
-
82
-
83
-
84
-
85
-
86
-
87
-
88
-
89
-
90
-
91
-
92
-
93
-
94
-
95
-
96
-
97
-
98
-
99
-
100
-
101
-
102
-
103
-
104
-
105
-
106
-
107
-
108
-
109
-
110
-
111
-
112
-
113
-
114
-
115
-
116
-
117
-
118
-
119
-
120
-
121
-
122
-
123
-
124
-
125
-
126
-
127
-
128
-
129
-
130
-
131
-
132
-
133
-
134
-
135
-
136
-
137
-
138
-
139
-
140
-
141
-
142
-
143
-
144
-
145
-
146
-
147
-
148
-
149
-
150
-
151
-
152
-
153
-
154
-
155
-
156
-
157
-
158
-
159
-
160
-
161
-
162
-
163
-
164
-
165
-
166
-
167
-
168
-
169
-
170
-
171
-
172
-
173
-
174
-
175
-
176
 |
 |

24FEB201107214112
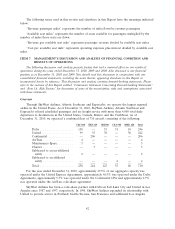
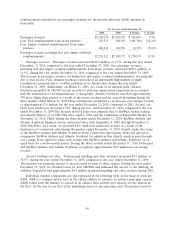
The following graph compares the cumulative total shareholder return on our common stock over
the five-year period ended December 31, 2010, with the cumulative total return during such period of
the Nasdaq Stock Market (U.S. Companies) and a peer group index composed of regional and major
passenger airlines with U.S operations that have equity securities traded on the Nasdaq Stock Market
or the New York Stock Exchange, the members of which are identified below (the ‘‘Peer Group’’) for
the same period. The following graph assumes an initial investment of $100.00 with dividends
reinvested. The stock performance shown on the graph below represents historical stock performance
and is not necessarily indicative of future stock price performance.
Comparison of Cumulative Five Year Total Return
$0
$50
$100
$150
$200
2005 2006 2007 2008 2009 2010
SkyWest, Inc.
NASDAQ Composite
Peer Group
INDEXED RETURNS
Base Years Ending
Period
Company Name / Index Dec05 Dec06 Dec07 Dec08 Dec09 Dec10
SkyWest, Inc. ............................ 100 95.41 100.90 70.44 64.85 60.56
NASDAQ Composite ....................... 100 111.74 124.67 73.77 107.12 125.93
Peer Group .............................. 100 106.13 69.92 49.08 50.74 61.65
The Peer Group consists of regional and major passenger airlines with U.S operations that have
equity securities traded on the Nasdaq Stock Market or the New York Stock Exchange. The members
of the Peer Group are: AirTran Holdings, Inc.; Alaska Air Group, Inc.: Allegiant Travel Co.; AMR
Corp/DE; Delta Air Lines, Inc.; Great Lakes Aviation, LTD.; Hawaiian Holdings, Inc.; JetBlue
Airways, Corp.; Pinnacle Airlines, Corp.; Republic Airways, Holdings Inc.; SkyWest, Inc. Southwest
Airlines, United Continental Holdings, Inc.; and US Airways Group, Inc .
40