SkyWest Airlines 2010 Annual Report Download - page 105
Download and view the complete annual report
Please find page 105 of the 2010 SkyWest Airlines annual report below. You can navigate through the pages in the report by either clicking on the pages listed below, or by using the keyword search tool below to find specific information within the annual report.-
 1
1 -
2
-
3
-
4
-
5
-
6
-
7
-
8
-
9
-
10
-
11
-
12
-
13
-
14
-
15
-
16
-
17
-
18
-
19
-
20
-
21
-
22
-
23
-
24
-
25
-
26
-
27
-
28
-
29
-
30
-
31
-
32
-
33
-
34
-
35
-
36
-
37
-
38
-
39
-
40
-
41
-
42
-
43
-
44
-
45
-
46
-
47
-
48
-
49
-
50
-
51
-
52
-
53
-
54
-
55
-
56
-
57
-
58
-
59
-
60
-
61
-
62
-
63
-
64
-
65
-
66
-
67
-
68
-
69
-
70
-
71
-
72
-
73
-
74
-
75
-
76
-
77
-
78
-
79
-
80
-
81
-
82
-
83
-
84
-
85
-
86
-
87
-
88
-
89
-
90
-
91
-
92
-
93
-
94
-
 95
95 -
 96
96 -
 97
97 -
 98
98 -
 99
99 -
 100
100 -
 101
101 -
 102
102 -
 103
103 -
 104
104 -
 105
105 -
 106
106 -
 107
107 -
 108
108 -
 109
109 -
 110
110 -
 111
111 -
 112
112 -
 113
113 -
 114
114 -
 115
115 -
116
-
117
-
118
-
119
-
120
-
121
-
122
-
123
-
124
-
125
-
126
-
127
-
128
-
129
-
130
-
131
-
132
-
133
-
134
-
135
-
136
-
137
-
138
-
139
-
140
-
141
-
142
-
143
-
144
-
145
-
146
-
147
-
148
-
149
-
150
-
151
-
152
-
153
-
154
-
155
-
156
-
157
-
158
-
159
-
160
-
161
-
162
-
163
-
164
-
165
-
166
-
167
-
168
-
169
-
170
-
171
-
172
-
173
-
174
-
175
-
176
 |
 |

SKYWEST, INC. AND SUBSIDIARIES
NOTES TO CONSOLIDATED FINANCIAL STATEMENTS (Continued)
DECEMBER 31, 2010
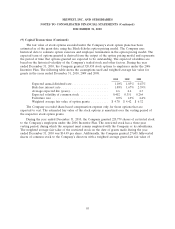
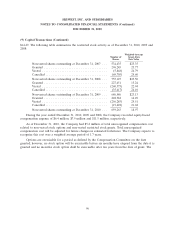
(13) Quarterly Financial Data (Unaudited)
Unaudited summarized financial data by quarter for 2010 and 2009 is as follows (in thousands,
except per share data):
Year Ended December 31, 2010
First Second Third Fourth
Quarter Quarter Quarter Quarter Year
Operating revenues (000) ............... $632,243 $649,759 $686,858 $796,285 $2,765,145
Operating income (000) ................ 42,421 49,288 58,282 51,835 201,826
Net income (000) .................... 15,014 18,655 25,474 37,207 96,350
Net income per common share:
Basic .............................. $ 0.27 0.33 0.46 0.68 1.73
Diluted ............................ 0.26 0.33 0.45 0.67 1.70
Weighted average common shares:
Basic: ............................. 55,855 55,936 55,901 54,747 55,610
Diluted: ........................... 56,864 56,718 56,804 55,719 56,526
Year Ended December 31, 2009
First Second Third Fourth
Quarter Quarter Quarter Quarter Year
Operating revenues (000) ............... $672,642 $698,823 $637,748 $604,401 $2,613,614
Operating income (000) ................ 40,824 59,769 63,253 48,349 212,195
Net income (000) .................... 9,372 26,219 28,566 19,501 83,658
Net income per common share:
Basic .............................. $ 0.17 $ 0.47 $ 0.51 $ 0.35 $ 1.50
Diluted ............................ 0.16 0.46 0.50 0.34 1.47
Weighted average common shares:
Basic: ............................. 56,546 55,657 55,605 55,606 55,854
Diluted: ........................... 57,427 56,558 56,652 56,621 56,814
101