SkyWest Airlines 2010 Annual Report Download - page 101
Download and view the complete annual report
Please find page 101 of the 2010 SkyWest Airlines annual report below. You can navigate through the pages in the report by either clicking on the pages listed below, or by using the keyword search tool below to find specific information within the annual report.-
 1
1 -
2
-
3
-
4
-
5
-
6
-
7
-
8
-
9
-
10
-
11
-
12
-
13
-
14
-
15
-
16
-
17
-
18
-
19
-
20
-
21
-
22
-
23
-
24
-
25
-
26
-
27
-
28
-
29
-
30
-
31
-
32
-
33
-
34
-
35
-
36
-
37
-
38
-
39
-
40
-
41
-
42
-
43
-
44
-
45
-
46
-
47
-
48
-
49
-
50
-
51
-
52
-
53
-
54
-
55
-
56
-
57
-
58
-
59
-
60
-
61
-
62
-
63
-
64
-
65
-
66
-
67
-
68
-
69
-
70
-
71
-
72
-
73
-
74
-
75
-
76
-
77
-
78
-
79
-
80
-
81
-
82
-
83
-
84
-
85
-
86
-
87
-
88
-
89
-
90
-
 91
91 -
 92
92 -
 93
93 -
 94
94 -
 95
95 -
 96
96 -
 97
97 -
 98
98 -
 99
99 -
 100
100 -
 101
101 -
 102
102 -
 103
103 -
 104
104 -
 105
105 -
 106
106 -
 107
107 -
 108
108 -
 109
109 -
 110
110 -
 111
111 -
112
-
113
-
114
-
115
-
116
-
117
-
118
-
119
-
120
-
121
-
122
-
123
-
124
-
125
-
126
-
127
-
128
-
129
-
130
-
131
-
132
-
133
-
134
-
135
-
136
-
137
-
138
-
139
-
140
-
141
-
142
-
143
-
144
-
145
-
146
-
147
-
148
-
149
-
150
-
151
-
152
-
153
-
154
-
155
-
156
-
157
-
158
-
159
-
160
-
161
-
162
-
163
-
164
-
165
-
166
-
167
-
168
-
169
-
170
-
171
-
172
-
173
-
174
-
175
-
176
 |
 |

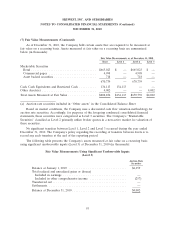
SKYWEST, INC. AND SUBSIDIARIES
NOTES TO CONSOLIDATED FINANCIAL STATEMENTS (Continued)
DECEMBER 31, 2010
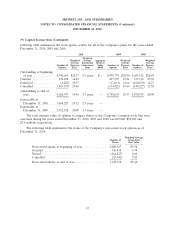
(9) Capital Transactions (Continued)
following table summarizes the stock option activity for all of the Company’s plans for the years ended
December 31, 2010, 2009 and 2008:
2010 2009 2008
Weighted
Weighted Average Aggregate Weighted Weighted
Average Remaining Intrinsic Average Average
Number of Exercise Contractual Value Number of Exercise Number of Exercise
Options Price Term ($000) Options Price Options Price
Outstanding at beginning
of year ............. 4,740,695 $20.37 3.8 years $— 4,470,734 $20.90 4,681,915 $20.01
Granted ............. 320,458 14.49 457,397 15.24 357,716 25.70
Exercised ............ (4,821) 10.57 (13,011) 14.64 (420,670) 14.27
Cancelled ............ (469,353) 20.46 (174,425) 19.66 (148,227) 23.38
Outstanding at end of
year ............... 4,586,979 19.96 3.3 years — 4,740,695 20.37 4,470,734 20.90
Exercisable at
December 31, 2010 .... 3,468,223 20.52 2.7 years —
Exercisable at
December 31, 2009 .... 3,652,528 20.00 3.3 years —
The total intrinsic value of options to acquire shares of the Company’s common stock that were
exercised during the years ended December 31, 2010, 2009 and 2008 was $19,000, $38,000 and
$2.4 million, respectively.
The following table summarizes the status of the Company’s non-vested stock options as of
December 31, 2010:
Weighted-Average
Number of Grant-Date
Shares Fair Value
Non-vested shares at beginning of year ............. 1,088,167 $5.98
Granted .................................... 320,458 4.78
Vested ..................................... (264,827) 8.06
Cancelled .................................. (25,042) 7.01
Non-vested shares at end of year .................. 1,118,756 $5.10
97