SkyWest Airlines 2010 Annual Report Download - page 57
Download and view the complete annual report
Please find page 57 of the 2010 SkyWest Airlines annual report below. You can navigate through the pages in the report by either clicking on the pages listed below, or by using the keyword search tool below to find specific information within the annual report.-
 1
1 -
2
-
3
-
4
-
5
-
6
-
7
-
8
-
9
-
10
-
11
-
12
-
13
-
14
-
15
-
16
-
17
-
18
-
19
-
20
-
21
-
22
-
23
-
24
-
25
-
26
-
27
-
28
-
29
-
30
-
31
-
32
-
33
-
34
-
35
-
36
-
37
-
38
-
39
-
40
-
41
-
42
-
43
-
44
-
45
-
46
-
 47
47 -
 48
48 -
 49
49 -
 50
50 -
 51
51 -
 52
52 -
 53
53 -
 54
54 -
 55
55 -
 56
56 -
 57
57 -
 58
58 -
 59
59 -
 60
60 -
 61
61 -
 62
62 -
 63
63 -
 64
64 -
 65
65 -
 66
66 -
 67
67 -
68
-
69
-
70
-
71
-
72
-
73
-
74
-
75
-
76
-
77
-
78
-
79
-
80
-
81
-
82
-
83
-
84
-
85
-
86
-
87
-
88
-
89
-
90
-
91
-
92
-
93
-
94
-
95
-
96
-
97
-
98
-
99
-
100
-
101
-
102
-
103
-
104
-
105
-
106
-
107
-
108
-
109
-
110
-
111
-
112
-
113
-
114
-
115
-
116
-
117
-
118
-
119
-
120
-
121
-
122
-
123
-
124
-
125
-
126
-
127
-
128
-
129
-
130
-
131
-
132
-
133
-
134
-
135
-
136
-
137
-
138
-
139
-
140
-
141
-
142
-
143
-
144
-
145
-
146
-
147
-
148
-
149
-
150
-
151
-
152
-
153
-
154
-
155
-
156
-
157
-
158
-
159
-
160
-
161
-
162
-
163
-
164
-
165
-
166
-
167
-
168
-
169
-
170
-
171
-
172
-
173
-
174
-
175
-
176
 |
 |

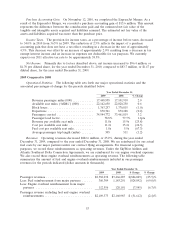
Purchase Accounting Gain. On November 12, 2010, we completed the ExpressJet Merger. As a
result of the ExpressJet Merger, we recorded a purchase accounting gain of $15.6 million. This amount
represents the difference between the consideration paid and the estimated net fair value of the
tangible and intangible assets acquired and liabilities assumed. The estimated net fair value of the
assets and liabilities acquired was more than the purchase price.
Income Taxes. The provision for income taxes, as a percentage of income before taxes, decreased
to 34.0% in 2010 from 36.5% in 2009. The reduction of 2.5% reflects the impact of a purchase
accounting gain that does not have a tax effect, resulting in a decrease in the rate of approximately
4.5%. This decrease was offset by an increase of approximately 2.0% resulting from a decrease in tax
exempt interest income and an increase in expenses not deductible for tax purposes. We currently
expects our 2011 effective tax rate to be approximately 38.5%.
Net Income. Primarily due to factors described above, net income increased to $96.4 million, or
$1.70 per diluted share, for the year ended December 31, 2010, compared to $83.7 million, or $1.47 per
diluted share, for the year ended December 31, 2009.
2009 Compared to 2008
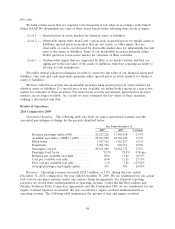
Operational Statistics. The following table sets forth our major operational statistics and the
associated percentages-of-change for the periods identified below.
Year Ended December 31,
2009 2008 % Change
Revenue passenger miles (000) ............ 17,448,958 17,101,910 2.0
Available seat miles (‘‘ASMs’’) (000) ........ 22,142,650 22,020,250 0.6
Block hours .......................... 1,363,257 1,376,815 (1.0)
Departures .......................... 870,761 872,288 (0.2)
Passengers carried ..................... 34,544,772 33,461,819 3.2
Passenger load factor ................... 78.8% 77.7% 1.1pts
Revenue per available seat mile ........... 11.8¢ 15.9¢ (25.8)
Cost per available seat mile .............. 11.2¢ 15.2¢ (26.3)
Fuel cost per available seat mile ........... 1.8¢ 5.5¢ (67.3)
Average passenger trip length (miles) ....... 505 511 (1.2)
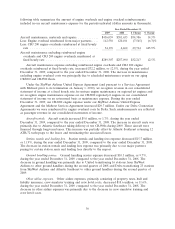
Revenues. Operating revenues decreased $882.6 million, or 25.2%, during the year ended
December 31, 2009, compared to the year ended December 31, 2008. We are reimbursed for our actual
fuel costs by our major partners under our contract flying arrangements. For financial reporting
purposes, we record these reimbursements as operating revenues. Under the SkyWest Airlines and
Atlantic Southeast Delta Connection Agreements, we are reimbursed for our engine overhaul expenses.
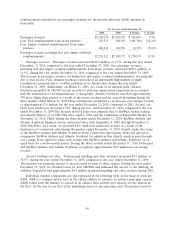
We also record those engine overhaul reimbursements as operating revenue. The following table
summarizes the amount of fuel and engine overhaul reimbursements included in our passenger
revenues for the periods indicated (dollar amounts in thousands).
Year Ended December 31,
2009 2008 $ Change % Change
Passenger revenues .......................... $2,582,238 $3,466,287 $(884,049) (25.5)%
Less: Fuel reimbursement from major partners ...... 360,309 1,185,201 (824,892) (69.6)%
Less: Engine overhaul reimbursement from major
partners ................................ 112,556 120,101 (7,545) (6.3)%
Passenger revenue excluding fuel and engine overhaul
reimbursements ........................... $2,109,373 $2,160,985 $ (51,612) (2.4)%
53