SkyWest Airlines 2010 Annual Report Download - page 62
Download and view the complete annual report
Please find page 62 of the 2010 SkyWest Airlines annual report below. You can navigate through the pages in the report by either clicking on the pages listed below, or by using the keyword search tool below to find specific information within the annual report.-
 1
1 -
2
-
3
-
4
-
5
-
6
-
7
-
8
-
9
-
10
-
11
-
12
-
13
-
14
-
15
-
16
-
17
-
18
-
19
-
20
-
21
-
22
-
23
-
24
-
25
-
26
-
27
-
28
-
29
-
30
-
31
-
32
-
33
-
34
-
35
-
36
-
37
-
38
-
39
-
40
-
41
-
42
-
43
-
44
-
45
-
46
-
47
-
48
-
49
-
50
-
51
-
 52
52 -
 53
53 -
 54
54 -
 55
55 -
 56
56 -
 57
57 -
 58
58 -
 59
59 -
 60
60 -
 61
61 -
 62
62 -
 63
63 -
 64
64 -
 65
65 -
 66
66 -
 67
67 -
 68
68 -
 69
69 -
 70
70 -
 71
71 -
 72
72 -
73
-
74
-
75
-
76
-
77
-
78
-
79
-
80
-
81
-
82
-
83
-
84
-
85
-
86
-
87
-
88
-
89
-
90
-
91
-
92
-
93
-
94
-
95
-
96
-
97
-
98
-
99
-
100
-
101
-
102
-
103
-
104
-
105
-
106
-
107
-
108
-
109
-
110
-
111
-
112
-
113
-
114
-
115
-
116
-
117
-
118
-
119
-
120
-
121
-
122
-
123
-
124
-
125
-
126
-
127
-
128
-
129
-
130
-
131
-
132
-
133
-
134
-
135
-
136
-
137
-
138
-
139
-
140
-
141
-
142
-
143
-
144
-
145
-
146
-
147
-
148
-
149
-
150
-
151
-
152
-
153
-
154
-
155
-
156
-
157
-
158
-
159
-
160
-
161
-
162
-
163
-
164
-
165
-
166
-
167
-
168
-
169
-
170
-
171
-
172
-
173
-
174
-
175
-
176
 |
 |

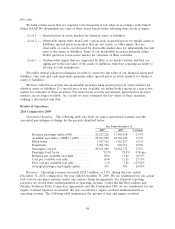
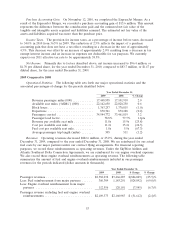
the break-up fee from Continental in June 2008. The break-up fee, net of our direct transaction costs,
was $6.3 million (pre-tax) and was recorded as other income during the year ended December 31, 2008.
Income taxes. The provision for income taxes, as a percentage of income before taxes, increased
to 36.5% in 2009 from 35.9% in 2008. The lower 2008 rate includes the impact of a decrease to the
effective state income tax rate as the result of state tax law changes in Utah and other states. The state
effective tax rate also decreased slightly from 2008 to 2009 minimizing the increase of the effective tax
rate from 2008 to 2009.
Net Income. Primarily due to factors described above, net income decreased to $83.7 million, or
$1.47 per diluted share, for the year ended December 31, 2009, compared to $112.9 million, or $1.93
per diluted share, for the year ended December 31, 2008.
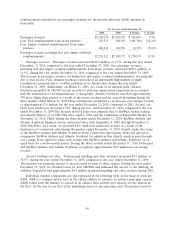
Liquidity and Capital Resources
Sources and Uses of Cash
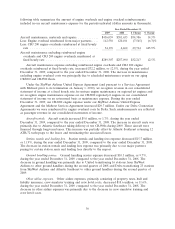
Cash Position and Liquidity. The following table provides a summary of the net cash provided by
(used in) our operating, investing and financing activities for the year ended December 31, 2010 and
2009 and total cash and marketable securities position as of December 31, 2010 and December 31,
2009 (in thousands).
For the year ended December 31,
2010 2009 $ Change % Change
Net cash provided by operating
activities .................... $347,089 $ 362,865 $ (15,776) (4.3)%
Net cash used in investing activities . . (177,376) (563,177) 385,801 68.5%
Net cash provided by (used in)
financing activities ............. (133,789) 150,834 (284,623) (188.7)%
December 31, December 31,
2010 2009 $ Change % Change
Cash and cash equivalents ........ $112,338 $ 76,414 $35,924 47.0%
Restricted cash ................ 21,775 10,730 11,045 102.9%
Marketable securities ............ 670,739 645,301 25,438 3.9%
Total ........................ $804,852 $732,445 $72,407 9.9%
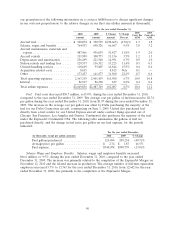
Cash Flows from Operating Activities.
Net cash provided by operating activities decreased $15.8 million or 4.3%, during the year ended
December 31, 2010, compared to the year ended December 31, 2009. The decrease was primarily due
to changes in accounts payable. During the year ended December 31, 2010, accounts payable and
accrued aircraft rents increased $6.3 million as compared to an increase in accounts payable and
accrued aircraft rents of $46.9 million during the year ended December 31, 2009. The decrease in the
change in accounts payable was due primarily to the timing of our payments of engine overhaul
expenses.
Cash Flows from Investing Activities.
Net cash used in investing activities decreased $385.8 million or 68.5%, during the year ended
December 31, 2010, compared to the year ended December 31, 2009. Our aircraft and rotable spare
parts purchased decreased $250.9 million during the year ended December 31, 2010 as compared to the
year ended December 31, 2009. The decrease in aircraft and rotable spares was primarily due to the
58