SkyWest Airlines 2010 Annual Report Download - page 46
Download and view the complete annual report
Please find page 46 of the 2010 SkyWest Airlines annual report below. You can navigate through the pages in the report by either clicking on the pages listed below, or by using the keyword search tool below to find specific information within the annual report.-
 1
1 -
2
-
3
-
4
-
5
-
6
-
7
-
8
-
9
-
10
-
11
-
12
-
13
-
14
-
15
-
16
-
17
-
18
-
19
-
20
-
21
-
22
-
23
-
24
-
25
-
26
-
27
-
28
-
29
-
30
-
31
-
32
-
33
-
34
-
35
-
 36
36 -
 37
37 -
 38
38 -
 39
39 -
 40
40 -
 41
41 -
 42
42 -
 43
43 -
 44
44 -
 45
45 -
 46
46 -
 47
47 -
 48
48 -
 49
49 -
 50
50 -
 51
51 -
 52
52 -
 53
53 -
 54
54 -
 55
55 -
 56
56 -
57
-
58
-
59
-
60
-
61
-
62
-
63
-
64
-
65
-
66
-
67
-
68
-
69
-
70
-
71
-
72
-
73
-
74
-
75
-
76
-
77
-
78
-
79
-
80
-
81
-
82
-
83
-
84
-
85
-
86
-
87
-
88
-
89
-
90
-
91
-
92
-
93
-
94
-
95
-
96
-
97
-
98
-
99
-
100
-
101
-
102
-
103
-
104
-
105
-
106
-
107
-
108
-
109
-
110
-
111
-
112
-
113
-
114
-
115
-
116
-
117
-
118
-
119
-
120
-
121
-
122
-
123
-
124
-
125
-
126
-
127
-
128
-
129
-
130
-
131
-
132
-
133
-
134
-
135
-
136
-
137
-
138
-
139
-
140
-
141
-
142
-
143
-
144
-
145
-
146
-
147
-
148
-
149
-
150
-
151
-
152
-
153
-
154
-
155
-
156
-
157
-
158
-
159
-
160
-
161
-
162
-
163
-
164
-
165
-
166
-
167
-
168
-
169
-
170
-
171
-
172
-
173
-
174
-
175
-
176
 |
 |

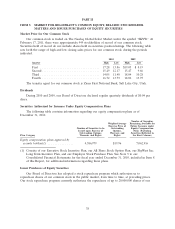
The following terms used in this section and elsewhere in this Report have the meanings indicated
below:
‘‘Revenue passenger miles’’ represents the number of miles flown by revenue passengers.
‘‘Available seat miles’’ represents the number of seats available for passengers multiplied by the
number of miles those seats are flown.
‘‘Revenue per available seat mile’’ represents passenger revenue divided by available seat miles.
‘‘Cost per available seat mile’’ represents operating expenses plus interest divided by available seat
miles.
ITEM 7. MANAGEMENT’S DISCUSSION AND ANALYSIS OF FINANCIAL CONDITION AND
RESULTS OF OPERATIONS
The following discussion and analysis presents factors that had a material effect on our results of
operations during the years ended December 31, 2010, 2009 and 2008. Also discussed is our financial
position as of December 31, 2010 and 2009. You should read this discussion in conjunction with our
consolidated financial statements, including the notes thereto, appearing elsewhere in this Report or
incorporated herein by reference. This discussion and analysis contains forward-looking statements. Please
refer to the sections of this Report entitled ‘‘Cautionary Statement Concerning Forward-looking Statements’’
and ‘‘Item 1A. Risk Factors’’ for discussion of some of the uncertainties, risks and assumptions associated
with these statements.
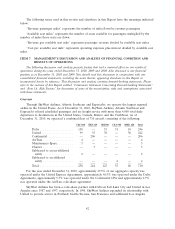
Overview
Through SkyWest Airlines, Atlantic Southeast and ExpressJet, we operate the largest regional
airline in the United States. As of December 31, 2010, SkyWest Airlines, Atlantic Southeast and
ExpressJet offered scheduled passenger and air freight service with more than 4,000 total daily
departures to destinations in the United States, Canada, Mexico and the Caribbean. As of
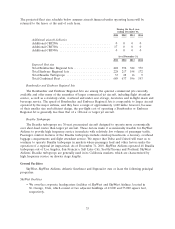
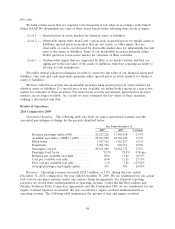
December 31, 2010, we operated a combined fleet of 710 aircraft consisting of the following:
CRJ 200 ERJ 145 CRJ700 CRJ 900 EMB 120 Total
Delta ................... 150 — 55 31 10 246
United .................. 99 35 70 — 38 242
Continental .............. — 206 — — — 206
AirTran ................. 4 — — — — 4
Maintenance Spare ......... 3 — — — — 3
Charter ................. — 3 — — — 3
Subleased to an un-affiliated
entity ................. 2 — — — — 2
Subleased to an affiliated
entity ................. — — — 4 — 4
Total ................... 258 244 125 35 48 710
For the year ended December 31, 2010, approximately 47.5% of our aggregate capacity was
operated under the United Express Agreements, approximately 46.5% was operated under the Delta
Agreements, approximately 5.3% was operated under the Continental CPA and approximately 0.7%
was operated under the AirTran code-share agreement.
SkyWest Airlines has been a code-share partner with Delta in Salt Lake City and United in Los
Angeles since 1987 and 1997, respectively. In 1998, SkyWest Airlines expanded its relationship with
United to provide service in Portland, Seattle/Tacoma, San Francisco and additional Los Angeles
42