Red Lobster 2012 Annual Report Download - page 65
Download and view the complete annual report
Please find page 65 of the 2012 Red Lobster annual report below. You can navigate through the pages in the report by either clicking on the pages listed below, or by using the keyword search tool below to find specific information within the annual report.-
 1
1 -
2
-
3
-
4
-
5
-
6
-
7
-
8
-
9
-
10
-
11
-
12
-
13
-
14
-
15
-
16
-
17
-
18
-
19
-
20
-
21
-
22
-
23
-
24
-
25
-
26
-
27
-
28
-
29
-
30
-
31
-
32
-
33
-
34
-
35
-
36
-
37
-
38
-
39
-
40
-
41
-
42
-
43
-
44
-
45
-
46
-
47
-
48
-
49
-
50
-
51
-
52
-
53
-
54
-
 55
55 -
 56
56 -
 57
57 -
 58
58 -
 59
59 -
 60
60 -
 61
61 -
 62
62 -
 63
63 -
 64
64 -
 65
65 -
 66
66 -
 67
67 -
 68
68 -
 69
69 -
 70
70 -
 71
71 -
 72
72 -
 73
73 -
 74
74
 |
 |

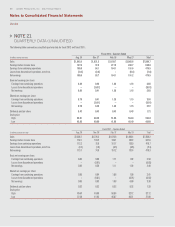
Notes to Consolidated Financial Statements
Darden
Darden Restaurants, Inc. 2012 Annual Report 61
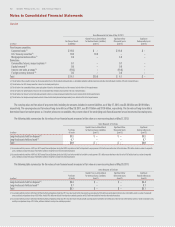
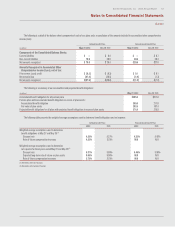
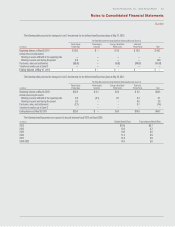
The following table presents the changes in Level 3 investments for the defined benefit pension plans at May 27, 2012:
Fair Value Measurements Using Significant Unobservable Inputs (Level 3)
Private Equity Private Equity Energy & Real Estate Real Asset
(in millions)
Partnerships Securities Public Sector Private Funds Total
Beginning balance at May 29, 2011 $ 25.6 $ — $ 4.3 $ 10.8 $ 40.7
Actual return on plan assets:
Relating to assets still held at the reporting date — — — — —
Relating to assets sold during the period 0.3 — — — 0.3
Purchases, sales and settlements (25.9) — (4.3) (10.8) (41.0)
Transfers in and/or out of Level 3 — — — — —
Ending balance at May 27, 2012 $ — $ — $ — $ — $ —
The following table presents the changes in Level 3 investments for the defined benefit pension plans at May 29, 2011:
Fair Value Measurements Using Significant Unobservable Inputs (Level 3)
Private Equity Private Equity Energy & Real Estate Real Asset
(in millions)
Partnerships Securities Public Sector Private Funds Total
Beginning balance at May 30, 2010 $22.9 $ 0.1 $4.2 $ 9.2 $36.4
Actual return on plan assets:
Relating to assets still held at the reporting date 2.8 (0.1) 0.1 0.3 3.1
Relating to assets sold during the period 2.0 — — 0.6 2.6
Purchases, sales, and settlements (2.1) — — 0.7 (1.4)
Transfers in and/or out of Level 3 — — — — —
Ending balance at May 29, 2011 $25.6 $ — $4.3 $10.8 $40.7
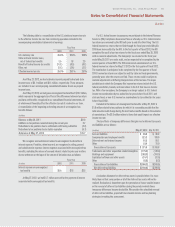
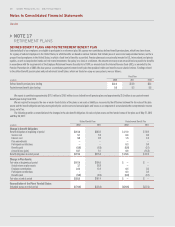
The following benefit payments are expected to be paid between fiscal 2013 and fiscal 2022:
(in millions)
Defined Benefit Plans Postretirement Benefit Plan
2013 $10.0 $0.7
2014 10.4 0.7
2015 10.9 0.8
2016 11.5 0.9
2017 12.4 0.9
2018–2022 74.6 6.0