Red Lobster 2012 Annual Report Download - page 24
Download and view the complete annual report
Please find page 24 of the 2012 Red Lobster annual report below. You can navigate through the pages in the report by either clicking on the pages listed below, or by using the keyword search tool below to find specific information within the annual report.-
 1
1 -
2
-
3
-
4
-
5
-
6
-
7
-
8
-
9
-
10
-
11
-
12
-
13
-
 14
14 -
 15
15 -
 16
16 -
 17
17 -
 18
18 -
 19
19 -
 20
20 -
 21
21 -
 22
22 -
 23
23 -
 24
24 -
 25
25 -
 26
26 -
 27
27 -
 28
28 -
 29
29 -
 30
30 -
 31
31 -
 32
32 -
 33
33 -
 34
34 -
35
-
36
-
37
-
38
-
39
-
40
-
41
-
42
-
43
-
44
-
45
-
46
-
47
-
48
-
49
-
50
-
51
-
52
-
53
-
54
-
55
-
56
-
57
-
58
-
59
-
60
-
61
-
62
-
63
-
64
-
65
-
66
-
67
-
68
-
69
-
70
-
71
-
72
-
73
-
74
 |
 |

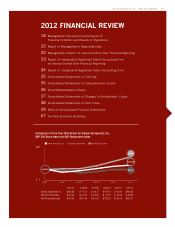
Management’s Discussion and Analysis
of Financial Condition and Results of Operations
Darden
20 Darden Restaurants, Inc. 2012 Annual Report
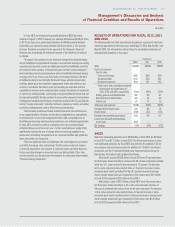
LongHorn Steakhouse’s sales of $1.12 billion in fiscal 2012 were 13.5 percent
above last fiscal year, driven primarily by revenue from 32 net new restaurants
combined with a same-restaurant sales increase of 5.3 percent. The increase in
same-restaurant sales resulted from a 4.8 percent increase in same-restaurant
guest counts combined with a 0.5 percent increase in average guest check.
Average annual sales per restaurant for LongHorn Steakhouse were $3.0 million
in fiscal 2012 compared to $2.9 million in fiscal 2011.
In total, The Capital Grille, Bahama Breeze, Seasons 52 and Eddie V’s
generated sales of $623.0 million in fiscal 2012, which were 24.1 percent above
last fiscal year, primarily driven by 2 net new restaurants at The Capital Grille,
4 new restaurants at Bahama Breeze, 6 new restaurants at Seasons 52 and the
addition of 11 Eddie V’s purchased restaurants. Additionally, sales growth
reflected same-restaurant sales increases of 5.3 percent at The Capital Grille,
3.4 percent at Bahama Breeze and 3.8 percent at Seasons 52. Average annual
sales per restaurant for The Capital Grille were $6.8 million in fiscal 2012
compared to $6.5 million in fiscal 2011. Average annual sales per restaurant for
Bahama Breeze were $5.6 million in fiscal 2012 compared to $5.5 million in
fiscal 2011. Average annual sales per restaurant for Seasons 52 were $6.4 million
in fiscal 2012 compared to $6.3 million in fiscal 2011.
The 5.4 percent increase in sales from continuing operations for fiscal 2011
was driven by the addition of 70 net new company-owned restaurants and the
1.4 percent blended same-restaurant sales increase for Olive Garden, Red Lobster
and LongHorn Steakhouse.
Olive Garden’s sales of $3.49 billion in fiscal 2011 were 5.2 percent above
fiscal 2010, driven primarily by revenue from 31 net new restaurants combined
with a U.S. same-restaurant sales increase of 1.2 percent. The increase in U.S.
same-restaurant sales resulted from a 1.5 percent increase in average guest
check partially offset by a 0.3 percent decrease in same-restaurant guest counts.
Average annual sales per restaurant for Olive Garden were $4.8 million in fiscal
2011 compared to $4.7 million in fiscal 2010.
Red Lobster’s sales of $2.52 billion in fiscal 2011 were 1.3 percent above
fiscal 2010, driven primarily by revenue from four net new restaurants combined
with a U.S. same-restaurant sales increase of 0.3 percent. The increase in U.S.
same-restaurant sales resulted from a 2.2 percent increase in average guest
check partially offset by a 1.9 percent decrease in same-restaurant guest counts.
Average annual sales per restaurant for Red Lobster were $3.6 million in fiscal
2011 and fiscal 2010.
LongHorn Steakhouse’s sales of $983.7 million in fiscal 2011 were
11.6 percent above fiscal 2010, driven primarily by revenue from 23 net new
restaurants combined with a same-restaurant sales increase of 5.4 percent.
The increase in same-restaurant sales resulted from a 3.4 percent increase in
same-restaurant guest counts combined with a 2.0 percent increase in average
guest check. Average annual sales per restaurant for LongHorn Steakhouse were
$2.9 million in fiscal 2011 compared to $2.7 million in fiscal 2010.
In total, The Capital Grille, Bahama Breeze and Seasons 52 generated sales
of $502.2 million in fiscal 2011, which were 19.0 percent above fiscal 2010,
primarily driven by four new restaurants at The Capital Grille, one new restaurant
at Bahama Breeze and six new restaurants at Seasons 52. Additionally, sales
growth reflected same-restaurant sales increases of 6.2 percent at The Capital
Grille, 2.4 percent at Bahama Breeze and 4.4 percent at Seasons 52. Average
annual sales per restaurant for The Capital Grille were $6.5 million in fiscal 2011
compared to $6.2 million in fiscal 2010. Average annual sales per restaurant for
Bahama Breeze were $5.5 million in fiscal 2011 compared to $5.4 million in fiscal
2010. Average annual sales per restaurant for Seasons 52 were $6.3 million in
fiscal 2011 compared to $5.9 million in fiscal 2010.
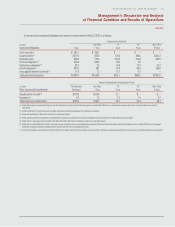
COSTS AND EXPENSES
Total costs and expenses from continuing operations were $7.36 billion in fiscal
2012, $6.85 billion in fiscal 2011 and $6.57 billion in fiscal 2010. As a percent of
sales, total costs and expenses from continuing operations were 92.0 percent
in fiscal 2012, 91.4 percent in fiscal 2011 and 92.4 percent in fiscal 2010.
Food and beverage costs increased $287.0 million, or 13.2 percent, from
$2.17 billion in fiscal 2011 to $2.46 billion in fiscal 2012. Food and beverage
costs increased $122.4 million, or 6.0 percent, from $2.05 billion in fiscal 2010
to $2.17 billion in fiscal 2011. As a percent of sales, food and beverage costs
increased from fiscal 2011 to fiscal 2012 primarily as a result of higher seafood
and other food commodity costs and unfavorable menu-mix, partially offset by
pricing. As a percent of sales, food and beverage costs increased from fiscal
2010 to fiscal 2011 primarily as a result of higher seafood and other commodity
costs, partially offset by pricing.
Restaurant labor costs increased $105.1 million, or 4.4 percent, from
$2.40 billion in fiscal 2011 to $2.50 billion in fiscal 2012. Restaurant labor costs
increased $46.3 million, or 2.0 percent, from $2.35 billion in fiscal 2010 to
$2.40 billion in fiscal 2011. As a percent of sales, restaurant labor costs decreased
in fiscal 2012 primarily as a result of sales leveraging, improved wage-rate
management and lower manager incentive compensation, partially offset by an
increase in FICA taxes on higher reported tips. The increase in FICA tax expense
on higher reported tips is fully offset in our consolidated earnings from continuing
operations by a corresponding income tax credit, which reduces income tax
expense. As a percent of sales, restaurant labor costs decreased in fiscal 2011
primarily as a result of pricing, increased employee productivity, lower manager
incentive compensation, decreased employee insurance claims costs and
improved wage-rate management, partially offset by higher unemployment taxes.
Restaurant expenses (which include utilities, repairs and maintenance,
credit card, lease, property tax, workers’ compensation, new restaurant pre-
opening and other restaurant-level operating expenses) increased $71.6 million,
or 6.3 percent, from $1.13 billion in fiscal 2011 to $1.20 billion in fiscal 2012.
Restaurant expenses increased $46.8 million, or 4.3 percent, from $1.08 billion
in fiscal 2010 to $1.13 billion in fiscal 2011. As a percent of sales, restaurant
expenses decreased in fiscal 2012 as compared to fiscal 2011 primarily due to
sales leveraging and lower credit card fees partially offset by higher workers’
compensation costs. As a percent of sales, restaurant expenses decreased in
fiscal 2011 as compared to fiscal 2010 primarily due to pricing and lower general
liability expenses partially offset by higher credit card fees.
Selling, general and administrative expenses increased $4.1 million, or
0.6 percent, from $742.7 million in fiscal 2011 to $746.8 million in fiscal 2012.
Selling, general and administrative expenses increased $52.0 million, or
7.5 percent, from $690.7 million in fiscal 2010 to $742.7 million in fiscal 2011.
As a percent of sales, selling, general and administrative expenses decreased from
fiscal 2011 to fiscal 2012 primarily due to sales leveraging, lower performance
incentive compensation and favorable market-driven changes in fair value
related to our non-qualified deferred compensation plans, partially offset by