Red Lobster 2012 Annual Report Download - page 22
Download and view the complete annual report
Please find page 22 of the 2012 Red Lobster annual report below. You can navigate through the pages in the report by either clicking on the pages listed below, or by using the keyword search tool below to find specific information within the annual report.-
 1
1 -
2
-
3
-
4
-
5
-
6
-
7
-
8
-
9
-
10
-
11
-
 12
12 -
 13
13 -
 14
14 -
 15
15 -
 16
16 -
 17
17 -
 18
18 -
 19
19 -
 20
20 -
 21
21 -
 22
22 -
 23
23 -
 24
24 -
 25
25 -
 26
26 -
 27
27 -
 28
28 -
 29
29 -
 30
30 -
 31
31 -
 32
32 -
33
-
34
-
35
-
36
-
37
-
38
-
39
-
40
-
41
-
42
-
43
-
44
-
45
-
46
-
47
-
48
-
49
-
50
-
51
-
52
-
53
-
54
-
55
-
56
-
57
-
58
-
59
-
60
-
61
-
62
-
63
-
64
-
65
-
66
-
67
-
68
-
69
-
70
-
71
-
72
-
73
-
74
 |
 |

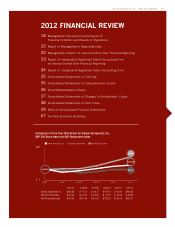
Management’s Discussion and Analysis
of Financial Condition and Results of Operations
Darden
18 Darden Restaurants, Inc. 2012 Annual Report
This discussion and analysis below for Darden Restaurants, Inc. (Darden, the
Company, we, us or our) should be read in conjunction with our consolidated
financial statements and related financial statement notes found elsewhere in this
report. We operate on a 52/53 week fiscal year, which ends on the last Sunday
in May. Fiscal 2012, 2011 and 2010 each consisted of 52 weeks of operation.
OVERVIEW OF OPERATIONS
Our business operates in the full-service dining segment of the restaurant
industry, primarily in the United States. At May 27, 2012, we operated 1,994
Red Lobster®, Olive Garden®, LongHorn Steakhouse®, The Capital Grille®,
Bahama Breeze®, Seasons 52®, Eddie V’s Prime Seafood® and Wildfish Seafood
Grille® restaurants in the United States and Canada. Through subsidiaries, we
own and operate all of our restaurants in the United States and Canada, except
for three restaurants located in Central Florida that are owned by joint ventures
and managed by us. None of our restaurants in the United States or Canada are
franchised. As of May 27, 2012, we also had 28 restaurants outside the United
States and Canada operated by independent third parties pursuant to area
development and franchise agreements, including 5 LongHorn Steakhouse
restaurants in Puerto Rico, 22 Red Lobster restaurants in Japan and
1 Red Lobster restaurant in Dubai.
On November 14, 2011, we completed the acquisition of eight Eddie V’s
Prime Seafood restaurants and three Wildfish Seafood Grille restaurants (collec-
tively Eddie V’s) and all related assets and net working capital for $58.5 million
in cash. The results of operations from Eddie V’s, which are not material, are
included in our consolidated financial statements from the date of acquisition.
Our mission is to be the best in full-service dining, now and for generations.
We believe we can achieve this goal by continuing to build on our strategy to be
a multi-brand restaurant growth company, which is grounded in:
•Brandrelevance;
•Brandsupport;
•Avibrantbusinessmodel;
•Competitivelysuperiorleadership;and
•Aunifying,motivatingculture.
We seek to increase profits by leveraging our fixed and semi-fixed costs
with sales from new restaurants and increased guest traffic and sales at existing
restaurants. To evaluate our operations and assess our financial performance, we
monitor a number of operating measures, with a special focus on two key factors:
•Same-restaurantsales–whichisayear-over-yearcomparisonofeach
period’s sales volumes for restaurants open at least 16 months, including
recently acquired restaurants, regardless of when the restaurants were
acquired;and
•Restaurantearnings–whichisrestaurant-levelprofitability(restaurant
sales, less restaurant-level cost of sales, marketing and depreciation).
Increasing same-restaurant sales can improve restaurant earnings because
these incremental sales provide better leverage of our fixed and semi-fixed
restaurant-level costs. A restaurant brand can generate same-restaurant sales
increases through increases in guest traffic, increases in the average guest
check, or a combination of the two. The average guest check can be impacted by
menu price changes and by the mix of menu items sold. For each restaurant
brand, we gather daily sales data and regularly analyze the guest traffic counts
and the mix of menu items sold to aid in developing menu pricing, product offer-
ings and promotional strategies. We view same-restaurant guest counts as a
measure of the long-term health of a restaurant brand, while increases in average
check and menu mix may contribute more significantly to near-term profitability.
We focus on balancing our pricing and product offerings with other initiatives to
produce sustainable same-restaurant sales growth.
We compute same-restaurant sales using restaurants open at least
16 months because this period is generally required for new restaurant sales
levels to normalize. Sales at newly opened restaurants generally do not make a
significant contribution to profitability in their initial months of operation due to
operating inefficiencies. Our sales and expenses can be impacted significantly by
the number and timing of new restaurant openings and closings, relocation and
remodeling of existing restaurants. Pre-opening expenses each period reflect the
costs associated with opening new restaurants in current and future periods.
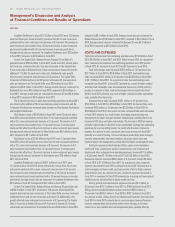
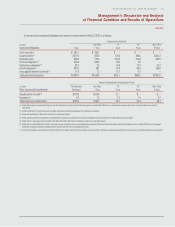
Fiscal 2012 Financial Highlights
Our sales from continuing operations were $8.00 billion in fiscal 2012 compared
to $7.50 billion in fiscal 2011. The 6.6 percent increase was primarily driven
by the addition of 89 net new company-owned restaurants plus the addition of
11 Eddie V’s purchased restaurants, and a blended same-restaurant sales
increase for Olive Garden, Red Lobster and LongHorn Steakhouse. Our blended same-
restaurant sales increase for Olive Garden, Red Lobster and LongHorn Steakhouse
of 1.8 percent compares to an increase of 1.3 percent for the Knapp-Track™
benchmark of U.S. same-restaurant sales excluding Darden. Net earnings from
continuing operations for fiscal 2012 were $476.5 million ($3.58 per diluted
share) compared with net earnings from continuing operations for fiscal 2011 of
$478.7 million ($3.41 per diluted share). Net earnings from continuing operations
for fiscal 2012 decreased 0.5 percent and diluted net earnings per share from
continuing operations increased 5.0 percent compared with fiscal 2011.
Our net losses from discontinued operations were $1.0 million ($0.01 per
diluted share) for fiscal 2012, compared with net losses from discontinued oper-
ations of $2.4 million ($0.02 per diluted share) for fiscal 2011. When combined
with results from continuing operations, our diluted net earnings per share were
$3.57 and $3.39 for fiscal 2012 and 2011, respectively.
Outlook and Strategy
On July 12, 2012, we entered into an agreement to acquire Yard House USA, Inc.
(Yard House), for $585.0 million in an all-cash transaction. The acquisition is
expected to be completed early in the second quarter of fiscal 2013. See the
subsection below entitled “Liquidity and Capital Resources” for further details.
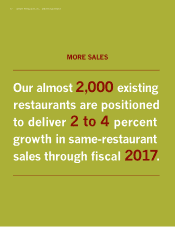
We expect blended U.S. same-restaurant sales in fiscal 2013 to increase
between 1.0 percent and 2.0 percent for Olive Garden, Red Lobster and
LongHorn Steakhouse. Including the impact from operations of Yard House, we
expect fiscal 2013 total sales to increase between 9.0 percent and 10.0 percent
and diluted net earnings per share growth from continuing operations for fiscal
2013 to range from 5.0 percent to 9.0 percent. In fiscal 2013, exclusive of the
Yard House transaction, we expect to add approximately 100 to 110 net new
restaurants, and we expect capital expenditures will be approximately
$750 million, including approximately $15 million to $20 million in information
technology platform enhancements.